Short answer: A Shopify spy workflow starts with one question: which stores are winning right now, and what do they sell? Spytrend Shops answers it from the store side: a database of 3.8M+ online stores you can filter by niche, country and traffic growth, and a card for every store with its monthly traffic, live ads, best-sellers and other stores on the same pixel. It does not show profit. It narrows the search. Part of the route is open without payment, the rest opens with Shops plans: what needs which plan is listed right after the intro and at each step.
An ad library shows you what is running. The rest is manual work: what kind of store this is, whether it is growing or burning budget, which ads keep running, what it sells and at what price. Shops covers that part in the same order as on the Shops page: find the store in the database, open the store, check the product, save what is worth watching.
One thing up front. Shops does not show a competitor's profit, and no Shopify spy tool or any other outside tool can see it. Its job is different: to narrow the search. Out of thousands of stores you are left with a couple of dozen that are growing, out of 1,600 ads from one store you get the 25 that survived three months of testing, and out of hundreds of products you get the ones several stores have advertised for months. From there you build a hypothesis and test it with your own budget, but not blind.
This Shopify spy walkthrough follows one store from start to finish. It is dogshood.com, dog harnesses and leashes on Shopify: one hero product, bundles built around it, and ads aimed at the United States and Canada. Between June and August its estimated traffic grew from 14K to 385K visits a month, more than 27 times.
In the interface this is a separate direction with its own menu: Shops (stores), Products (products seen in ads), Market overview (a market summary), Ads, Creatives, Webmasters and Hubs.
Figures were taken on 29 September and 1 October 2026, screenshots were refreshed on 2 October in the current interface. Numbers on the screenshots can differ by a few units (for example 726 active ads instead of 731): ads are launched and switched off every day.
What is free and what needs a plan
Shops is a separate subscription and does not change the rest of Spytrend. Without a plan the first rows of the list are open and you can open 10 store cards a day, which is enough to judge whether the section fits. The locked part is shown as a blurred sample with a connect button.
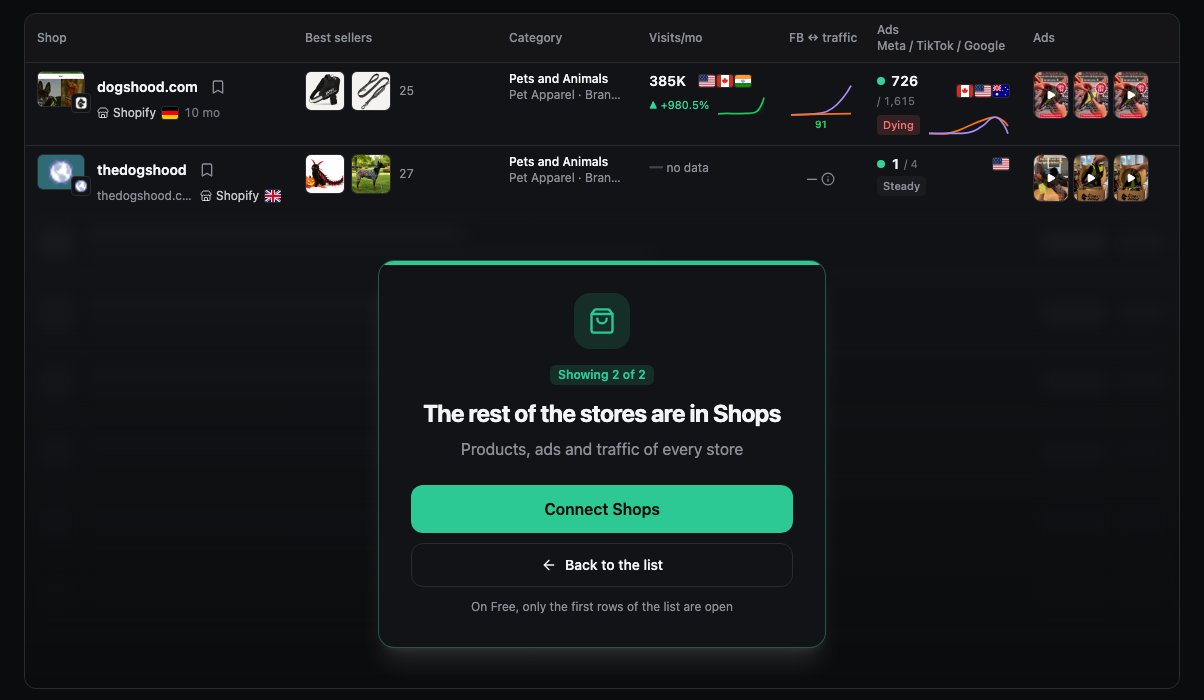
- No plan: first list rows, 10 cards a day.
- Base: the whole store database and filters, the card with traffic, the full product catalog, similar stores, the list of products seen in ads.
- Pro: store ads, Creative burn, ad launches vs traffic, product statistics, tracker IDs.
- Business: store contacts, other stores on the same tracker ID, Webmasters and Hubs inside Shops.
Each step below is marked with the plan it needs. Prices are on the pricing page.
Step 1. Find the store in the list
The first list rows are open without a plan, the full list from Base.
In the Shops list every row is a store: platform, domain age, best sellers, category, visits with trend, active and total ads, countries and the latest creatives.
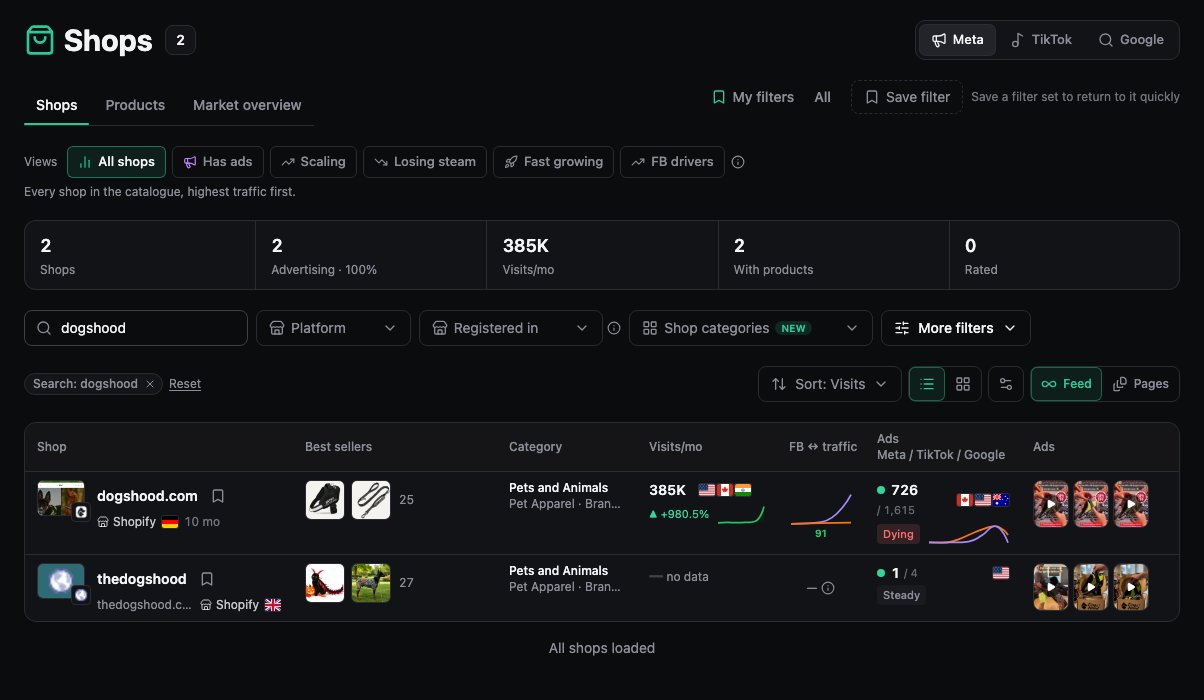
Ready-made views sit at the top: Has ads, Scaling, Losing steam, Fast growing, FB drivers. Scaling shows stores whose ad launches sped up last month, Fast growing removes everything whose traffic is standing still. These two views are the quickest way to find Shopify stores that are winning right now. Below are filters by platform, country, creation date, number of products, Shopify theme and apps, tags and categories. A set of filters is saved with the Save filter button.
The dogshood.com row: 385K visits a month and +980.5% against July. 731 active ads out of 1,615. The store is 10 months old.
The same search returned a second store, thedogshood.com, and it is a clone of dogshood. The catalog matches down to the product name "Dogshood ™ No Pull Harness", only cheaper: the harness is $35.99 instead of $39.99, and bundles are $3–5 lower. All 27 products were uploaded on 21–23 September, and the store theme is called "Dawn 的更新版副本 的副本", Chinese for "copy of a copy of Dawn". It has its own pixel and its advertising is only starting: 4 ads targeting the US.
A couple of months after the growth began, the store already had a clone. It is better to learn that from Shops than from a falling click-through rate.
Step 2. The store card: traffic and ads on one screen
Traffic and traffic sources from Base. The daily launches chart and ad launches vs traffic from Pro.
Clicking a store opens its card. At the top are the domain, the registration date (10 November 2025), the category Pets and Animals, the model Brand DTC, a short "In short" summary and a tag cloud: harness, dog gear, personalized, walking gear.
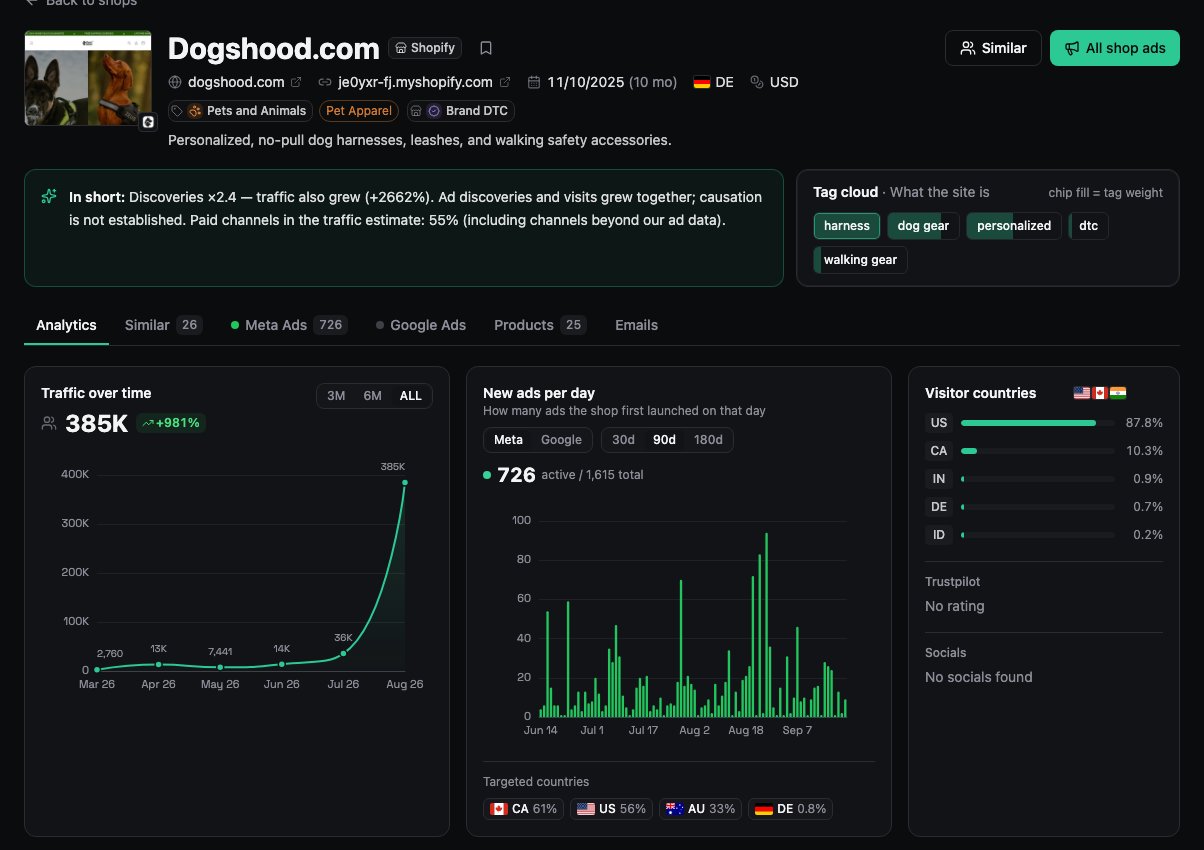
On the left is Traffic over time, estimated visits by month (how to read these estimates is covered in the article on competitor website traffic):
| Month | Visits |
|---|---|
| March | 2,760 |
| April | 13K |
| May | 7,441 |
| June | 14K |
| July | 36K |
| August | 385K |
On the right is New ads per day: how many new ads the store launched each day. In June and July these are bursts of 40–70 launches, and at the end of August the peaks reach 90 a day. Launches grow, and traffic follows.
Countries come as two lists (Targeted countries under the launches chart and Visitor countries next to the traffic chart), and they are worth comparing. Ads target Canada (62% of ads), the US (58%) and Australia (32%). Visitors: US 88%, Canada 10%. Australia is probably still a test, while most of the traffic comes from the US. Where the store earns its money is not visible from here: that takes conversion rate, average order value and returns for each country.
Below, the Ad launches ↔ Traffic card sets launches against visits: for dogshood.com new ads grew 2.4 times and visits 2,662% (from 14K to 385K), which makes 314 visits per ad. The service itself states that causation is not established, and you should read it the same way.
Step 3. Creative burn: which ads survived
Creative burn and every ad of the store from Pro.
This is the most useful block in the card. It shows what share of the ads launched in each month is still running.
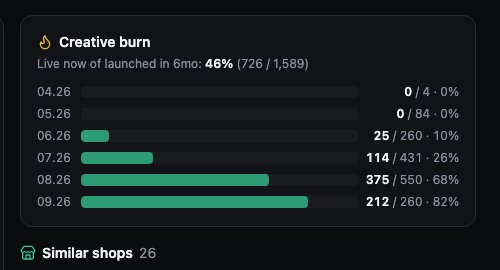
| Launch month | Still active | Share |
|---|---|---|
| April | 0 of 4 | 0% |
| May | 0 of 84 | 0% |
| June | 25 of 260 | 10% |
| July | 115 of 431 | 27% |
| August | 379 of 550 | 69% |
| September (month not finished) | 212 of 260 | 82% |
How to read it. Every spring test has been switched off. Of the June ads, 25 of 260 are still live, roughly one in ten, and they have been running for three months.
That is not proof that they pay back. An ad can stay active on almost no budget, work for only part of the audience or hold on thanks to repeat purchases. But the advertiser has kept them on for three months, so the result most likely suits them. These are the ads to study first.
All shop ads with the "Most re-uploaded" sort shows which headlines dogshood keeps running: "The No-Pull Harness That Turns Your Dog Around", "End Pulling Today" and "50% OFF + FREE SHIPPING". The same creative is uploaded 6–7 times, with countries split into separate ads. The ads lead not only to the product page but also to a separate page, /pages/easy-on-default, so the store built a dedicated landing page for advertising. Searching for creatives like these across the whole database, not one store, is covered in the article on the Creatives section.
Step 4. Best-sellers: what they sell and how they package it
Full catalog from Base.
The Products tab in the card shows the catalog with the best-sellers first: dogshood has 25 products on one theme, harnesses and leashes.
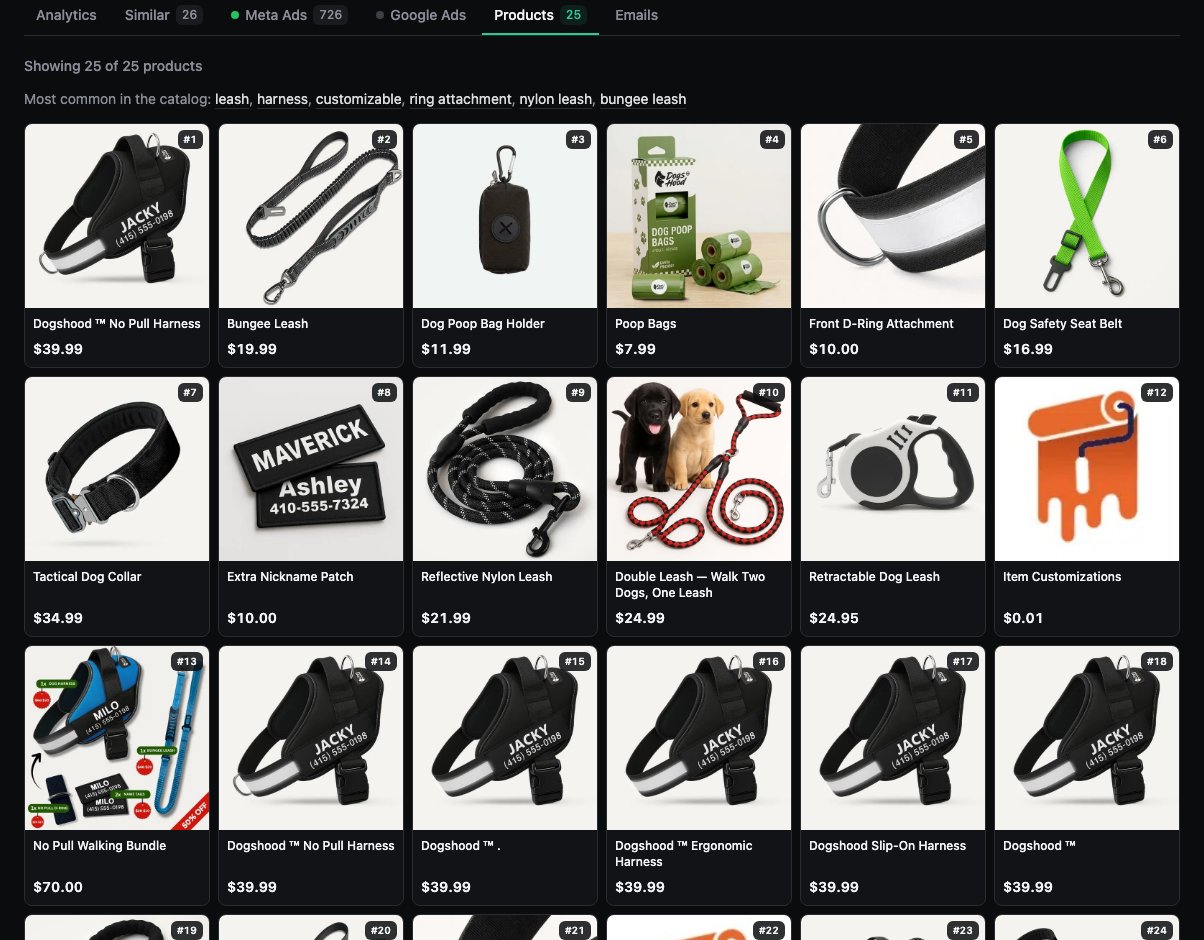
What the catalog shows:
- The hero product, the No Pull Harness at $39.99. The crossed-out price is $79.99, which is where the "50% OFF" in the ads comes from.
- Personalization. The dog's name and a phone number are embroidered on the harness. An extra name patch costs $10, a ready-made add-on to the order.
- Accessories: leash $19.99, poop bag holder $11.99, bags $7.99.
- Bundles. In mid-July the catalog gained Essentials Set at $61.99, Complete Walk Set at $81.99 and All-In-One No-Pull Set at $86.99. Right before traffic went up.
- Duplicate listings for upsell. The same leash sits as a separate item at $17.49 instead of $21.99. It looks like a post-purchase offer.
The real average order value cannot be seen from outside, but you can see how the store is trying to raise it.
Step 5. Stack and pixels: what the store invests in and where its other stores are
Pixels, stack and tracker IDs from Pro, the "ads with this pixel" button too. The "1 more shop" note (other stores on the same ID) from Business.
Lower in the card are the tabs Pixels / analytics, Apps and Theme, and below them the Tracking block.
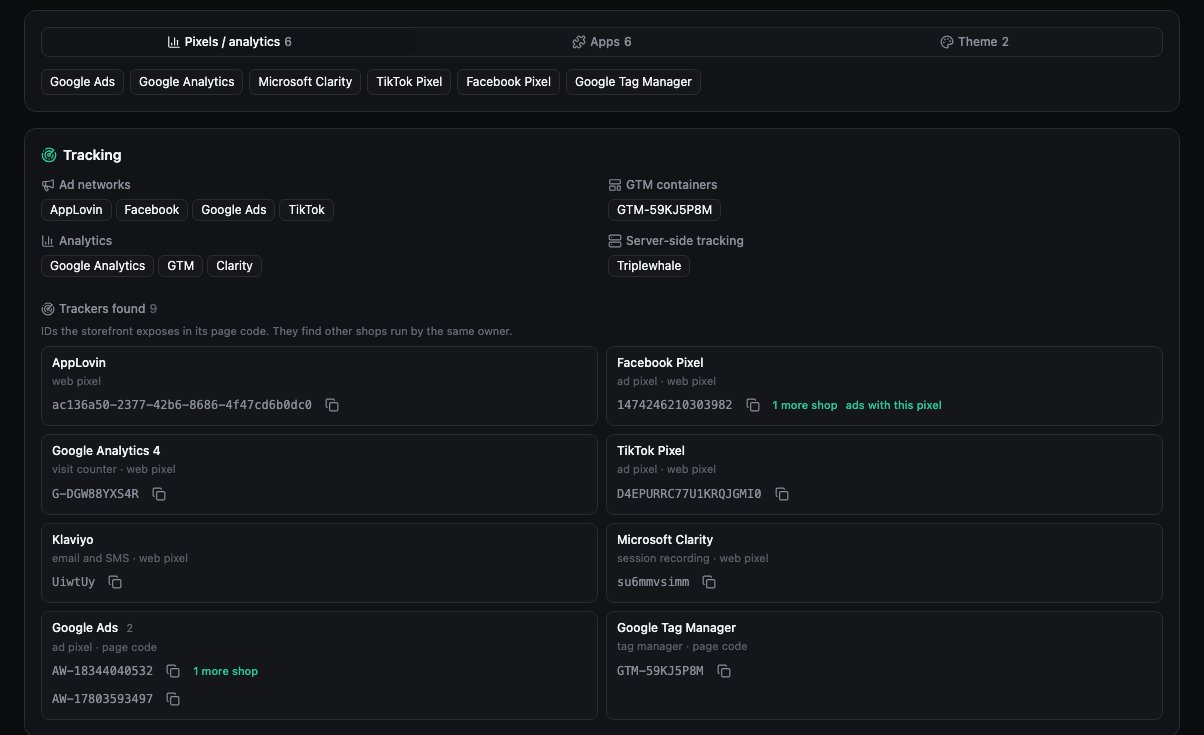
Apps: Klaviyo (email), Loox Reviews (photo reviews), Triple Whale (server-side tracking), Intelligems (price A/B tests), Microsoft Clarity (session recordings), Shop Pay.
There is no need to mirror the stack one to one: Triple Whale pays off at a noticeable budget, and price tests in Intelligems make sense once there is enough traffic. Something else is more valuable. The stack shows which jobs the store considers important enough to pay for a separate tool: email to its customer base, photo reviews, accurate attribution, price testing.
The Trackers found block is more interesting: it lists every ID the store exposes in its page code, and those IDs lead to other stores of the same owner.
The Facebook pixel of dogshood carries the note "1 more shop": the same pixel is installed on one more store. Next to it is the "ads with this pixel" button, which opens all advertising on that pixel. Clicking the note opens the Shops list filtered by this pixel.
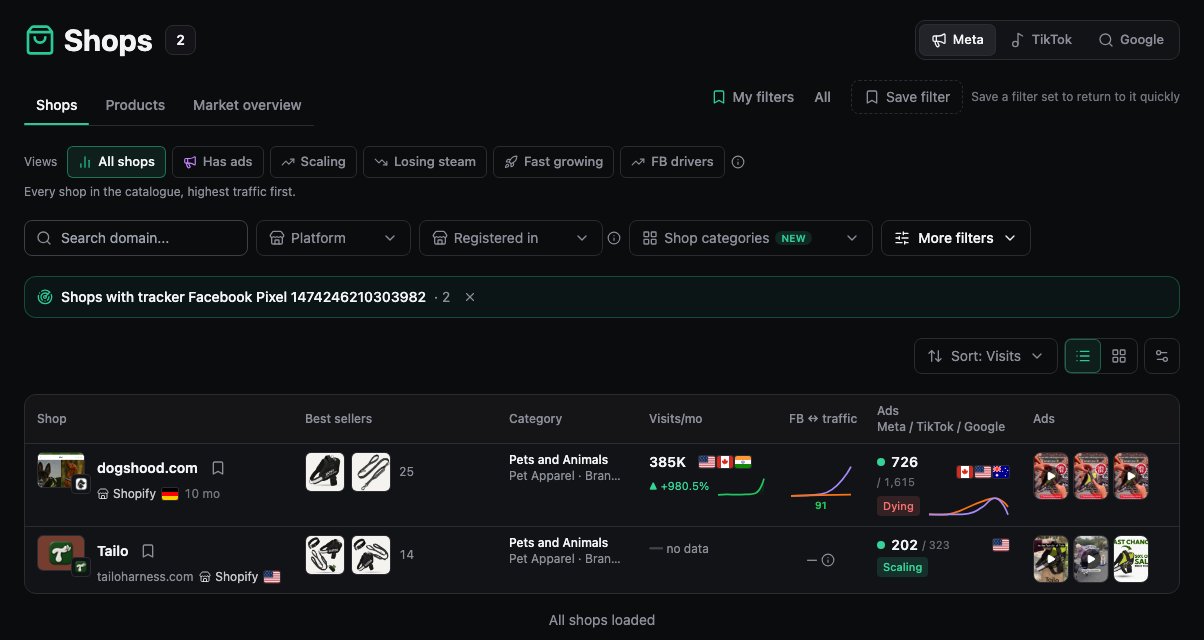
The second store is called Tailo, domain tailoharness.com. The catalog is familiar: the same Essentials Set at $61.99, Complete Walk Set at $81.99 and All-In-One No-Pull Set at $86.99, while the harness is renamed "Tailo® No Pull Harness" and costs the same $39.99. All 14 products were uploaded on 9 September, and the image file names still contain the word dogshood. The stack matches as well: Klaviyo, Loox, Triple Whale, Shop Pay.
Now look at the DYING label on dogshood in the same screenshot. Its launches in September really are lower: 260 against 550 in August. From the label alone it is easy to decide the store is fading. But Tailo launched 295 ads in that same September, all targeting the US, and it now has 192 active out of 313. Together that is 555 launches for the month. They did not shrink, they moved to a new brand.
A shared pixel plus the same catalog with dogshood images: most likely one owner is launching a second brand for the US. It is not guaranteed, since one contractor could have built both stores.
A weaker lead: some dogshood products list Tierhood.com as the vendor, and Shops contains tierhood.de, a German pet supplies store with the same Klaviyo, Loox and Shop Pay. They do not share a pixel, so this is a hypothesis to check through analytics IDs and the contacts on the site.
Step 6. Similar stores: the niche around it
Similar stores from Base.
The Similar tab collects stores with a similar assortment and tags. dogshood has 26 of them: six by assortment and 20 of 5,587 by tags.
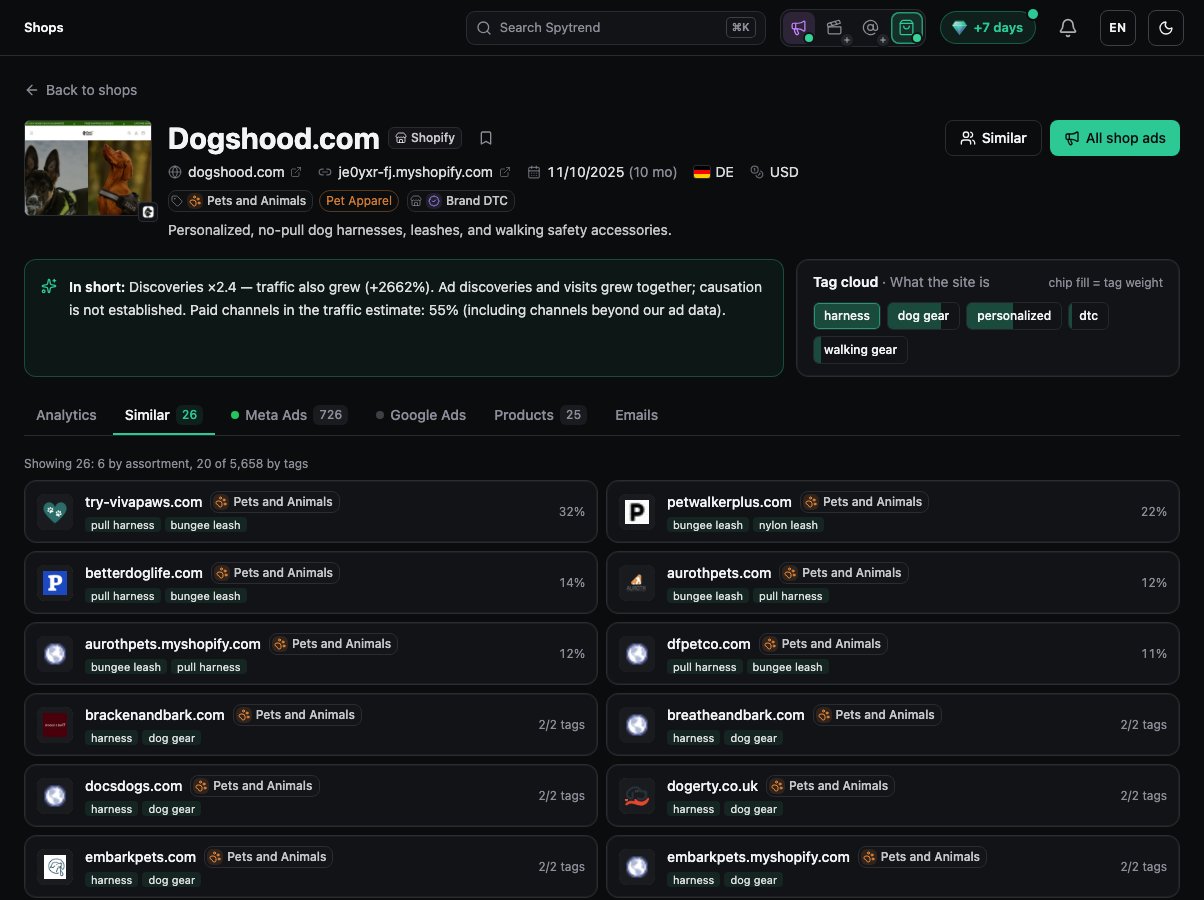
At the top are the closest by assortment: try-vivapaws.com (32% match), petwalkerplus.com (22%), betterdoglife.com (14%), aurothpets.com (12%), dfpetco.com (11%). All of them sell the same harnesses and bungee leashes.
This is a ready-made competitor list: run each one through the same card and you get a picture of the niche, not of a single store.
Step 7. Winning products: look at the product, not the store
The list of products seen in ads from Base. Status, days in ads, creatives and shops running now from Pro.
The Products item in the section menu (Products in ads and Competition) flips the logic. Here a card is a product, not a store, and it shows how many stores sell it. This is where dropshipping product research ends: you see whether a product is a winner many stores already advertise or a fresh test.
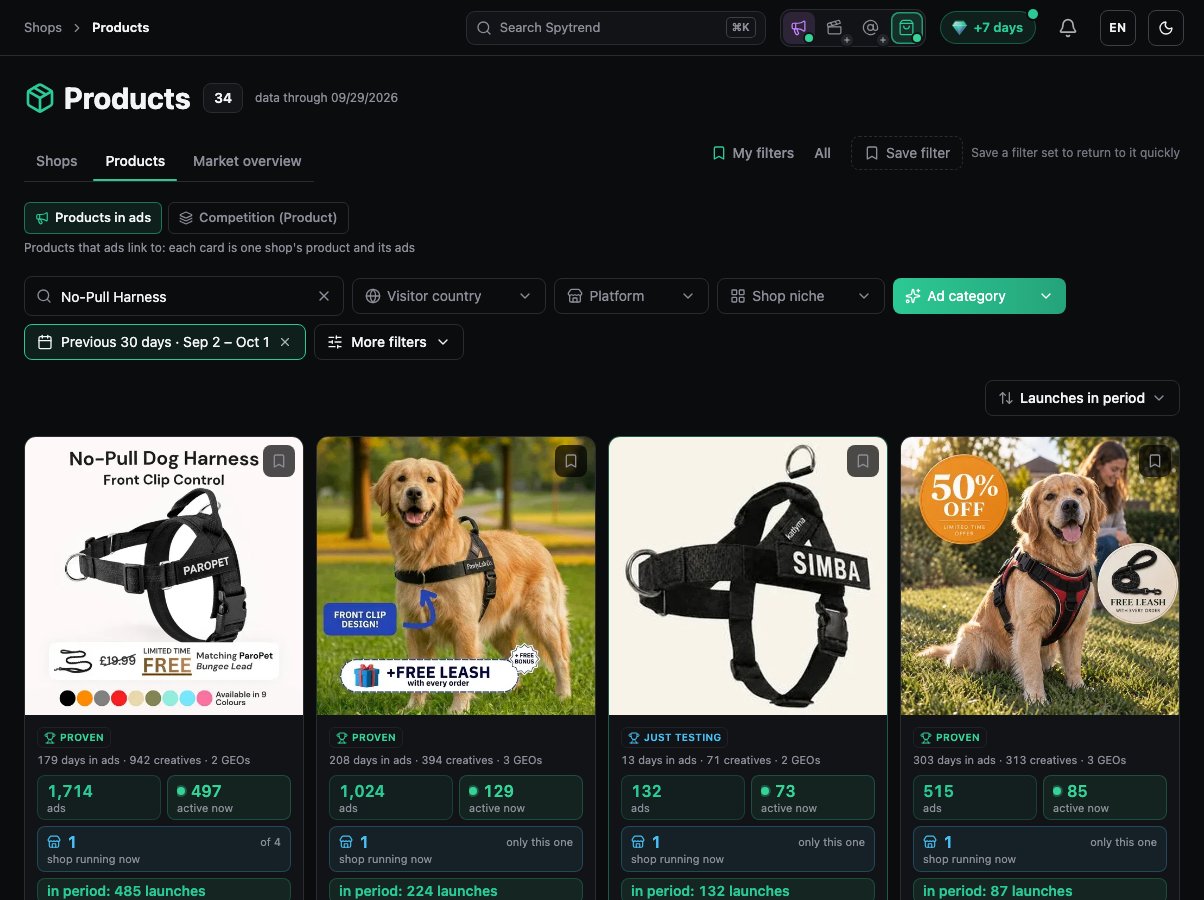
The query was No-Pull Harness, the period was the last 30 days, sorted by number of launches. A product card shows a status (PROVEN — ads have been running for months, HEATING — new and gaining, JUST TESTING — a few days in ads; RAN 30+ — ran for a month or longer), days in advertising, creatives and countries, total and active ads, launches for the period and shops running now: how many stores are advertising the same product at this moment.
What the harness results showed:
| Product | Status | Days in ads | Creatives | Ads / active | Price |
|---|---|---|---|---|---|
| ParoPet No Pull Dog Harness | PROVEN | 175 | 914 | 1,686 / 493 | £29.00 |
| No-Pull Harness (Auralis) | PROVEN | 204 | 394 | 1,013 / 134 | $39.95 |
| PawLife Walk No-Pull Dog Harness | JUST TESTING | 9 | 64 | 120 / 78 | A$59.95 |
| No-Pull Harness [Free Today] (Auralis) | PROVEN | 325 | 196 | 480 / 41 | no price |
| No-Pull Harness (mylowen.com) | PROVEN | 299 | 301 | 491 / 139 | $39.99 |
What follows from this:
- The no-pull harness is not one store's discovery. Several stores have advertised it for months, and Auralis has kept the same harness running for 325 days. Demand for it in advertising has held for a long time.
- The price in the niche is around $40. Entering at $60 means explaining the difference.
- A gift with the order is the norm here: the images say "+FREE LEASH with every order", "FREE Matching Bungee Lead", "50% OFF", "60 day money back". You can enter without one, but then you need another strong argument.
And separately PawLife: 9 days in advertising, already 64 creatives and 78 active ads. Someone is entering the niche right now and testing widely. In a couple of weeks its Creative burn will show what survived.
How to turn this into a decision. Signal: several stores have advertised a similar harness for 175–325 days. Hypothesis: the category has steady demand. Check: how many stores are active now, how long their ads live, which offers and countries they use. Decision: enter with your own angle in the offer, the bundle or the presentation, not with a lookalike product. As thedogshood shows, the lookalike will appear without you.
What else is in the section
A product page with the "All ads for …" button: which page the product is advertised from, in which format, with which offer and how many times each creative was uploaded. Market overview: a summary of all stores under your filters, including advertising stages and how selling is done in a country (cash on delivery, WhatsApp, subscription). Webmasters with the Pixel ID filter and Hubs → E-commerce with fresh stores on myshopify. Inside Shops these two sections open with Business, while in an Ads subscription they stay as they were.
After the product: who will promote it and with what video
The product is only half of the launch. Two more Spytrend pages cover the rest of the route.
- Creators to promote it. On the Influencers page you find YouTube and Instagram creators in the pet niche by country and audience size, see their recent videos and get their contacts: that is how you find YouTubers to sponsor instead of guessing.
- Videos that already took off. On the Content AI page you find viral Reels, TikToks and Shorts about dog harnesses — videos that got many times more views than their creator usually gets — see why they worked and get a script for your own video.
Where the data can mislead
Shops shows signals, not accounting. What to keep in mind:
- Many ads do not mean a large budget, and an active ad does not mean a working one: it can stay live with almost no impressions.
- Traffic in the card is an estimate for the previous month, not a counter and not revenue.
- Ads and traffic growing together is a coincidence in time, not a proven cause.
- A shared pixel is a strong sign of one owner, but not a guarantee.
- A status label is calculated for one domain. dogshood is labelled DYING, although the launches appear to have moved to Tailo.
- A discounted price is not the average order value, and a long run does not guarantee profit: a store can live on repeat purchases or misread its own analytics.
On its own each signal is weak. Together they are stronger: ads live for three months, launches grew three months in a row, traffic followed, bundles appear in the catalog, and other stores have advertised the same product for months. That does not prove profitability, but a store like this is worth studying first.
Summary: what one store gave and how to repeat it
- Niche, countries and offer: dog walking products, most traffic from the US, 50% off and free shipping.
- Packaging: a product at $39.99, personalization for $10, bundles up to $86.99, an upsell after payment.
- Candidates for working creatives: the June ads that have been live for three months.
- Jobs the store covers with its stack: email, photo reviews, attribution, price tests.
- Tailo on the same pixel (apparently the owner's second brand), a clone at thedogshood.com and 26 similar stores.
- The niche picture by product: five cards of the same harness across four stores, a price around $40, a gift with the order as the norm.
Repeating this Shopify spy routine on your own niche is simple. In Shops, turn on the Fast growing view, the Shopify platform and your category, then save the filter. In the store card go in order: traffic and launches, Creative burn, products, stack and trackers, similar stores. Then check the product in the Products tab: how many stores advertise it and with which offer.
Everything above is on the Spytrend Shops page: without payment you can do Step 1 and open a few cards, and the Base, Pro and Business plans are listed right on that page.
FAQ
How do you spy on a Shopify store?
Open the store in Shops: monthly traffic and its trend, new ads per day on Meta and Google, which ads have lived for months, the catalog with best-sellers, the app stack and the trackers in its page code. It takes a few minutes per store and no browser extension.
How do I find Shopify stores in my niche?
Filter the store database by niche (category), country, platform and traffic growth, or start from the Scaling and Fast growing views, then sort by visits or growth and save the filter.
What does the Shops section in Spytrend show?
A store's estimated traffic by month, the pace of its ad launches, the ads that outlived testing, the catalog with prices, the app stack and other stores on the same pixel. Shops does not show a competitor's profit; its job is to narrow the search.
How do you find winning products in Shops?
In the Products tab a card is a product, not a store. Each product shows a status (PROVEN, RAN 30+, HEATING or JUST TESTING), days in advertising, the number of creatives and ads, and shops running now, meaning how many stores are advertising it at this moment.
How can you tell which of a store's ads are working?
The Creative burn block shows what share of each month's ads is still running. For dogshood.com, 25 of 260 June ads are still live. That does not prove they pay back, but these are the ads to study first.
How do you find other stores of the same owner?
The Trackers found block lists every ID from the page code. The "1 more shop" note next to a pixel opens the list of stores with the same pixel. A shared pixel is a strong sign of one owner, but not a guarantee.
What is free in Shops?
The first rows of the store list and 10 store cards a day. The locked part is shown as a blurred sample. The full database and catalogs open with Base, store ads and product statistics with Pro, contacts and the store network with Business.
Can Shops tell you a store's profit?
No. Shops shows signals: estimated traffic for the previous month, the number of launches, how long ads live, prices in the catalog. Real average order value, conversion and returns are not visible from outside.