In short: A dropshipping automation platform handles sourcing, fulfillment and order routing after a sale. It can't tell you what to sell. That answer comes from outside your store: which products competitors pay to advertise, how long those ads run, and whether five stores selling one item are one business.
Every list of "winning products" has the same flaw. It tells you what's being advertised. It doesn't tell you what's being bought. The gap between those two facts is where dropshipping money gets lost. Picture a product that looked validated because forty stores ran ads for it last week. By the time the first container arrived, it was dead.
This page is about closing that gap before you commit. It covers the research step that comes before any choice of fulfillment tool: what evidence it runs on, and where that evidence lives.
What a dropshipping automation platform actually covers
A dropshipping automation platform connects your store, a Shopify storefront or any other, to suppliers on AliExpress or a private catalog. It takes over the repetitive work. It imports product data and sends each order to the supplier the moment it's placed. It syncs tracking numbers back to the customer, applies pricing rules and keeps stock counts honest when a supplier runs out. Judged on its own terms, a good platform earns its keep on fulfillment reliability. It keeps orders from stalling, holds shipping time steady, surfaces tracking fast and handles a supplier going dark.
None of that is product research, and the catalog inside such a platform can't replace it. A supplier catalog ranks items by what moves through the catalog. That measures what other dropshippers are ordering, so it reflects demand from sellers. It says nothing about buyers. A product can top that ranking because ten thousand stores just imported it. Those are the same stores that are about to compete with you, on the same creative, in the same auction.
So the order goes like this. First, decide what to sell using evidence from the open market. Then let the automation platform make the selling cheap to run. Reverse the two and you get a well-automated store with nothing worth automating.
"Advertised" and "selling" are not the same signal
Anyone can launch an ad. It costs a few dollars and proves only that somebody had an idea. What you want to know is what survived contact with a budget. That shows up in two places, both outside your own account.
How long the ad has been running. Ad spend is a decision that gets made again every day. A losing ad usually gets switched off within a week or two, because it costs money every day it stays up. An ad still live after a month isn't there by neglect. Someone is paying for it on purpose, and they can see its numbers while you can't.
Whether the creative has been re-uploaded. A test someone forgot to switch off will sit there running. Nobody re-uploads it. Each re-upload is a second decision to fund the same idea. That says more about a winner than any like count on the ad itself.
Everything below applies those two signals to a whole vertical instead of one ad. The screens are from Spytrend. In the company's own words, Spytrend is an ad intelligence platform for Facebook and TikTok advertising: an archive of ads going back to 2018, AI-classified into 33 business categories, with every advertiser assembled into a single card — all ads, pages, domains and countries in one place.
How I checked the vertical
I picked consumer electronics and gadgets in the United States, a classic dropshipping vertical. I ran every step below on it in Spytrend on the same day and captured each screen. All the numbers in this article come from those screens.
What this check doesn't show: it's one vertical, one country and one day, and the counters keep moving. I left Status on All, so the lists mix live ads with stopped ones. After I set Days to 30, the result counter didn't finish counting. So Step 2 has no clean before-and-after pair, and the survival rate comes from the country breakdown in Step 4. I also followed only one operator all the way through.
Step 1. See what the vertical is running right now
Start wide, with the category. Don't start with a product, and don't start inside the automation platform, which only ranks what its own users import. Filter ads by country, by the category your product would sit in, by format and by status. What you get is the roster of everyone competing in the auction you're about to enter. That includes operators you've never heard of.
For electronics and gadgets in the United States, I set two filters, and the counter read 1,629,156 ads. That's the raw size of the category: everything ever recorded running there, winners and abandoned tests together.
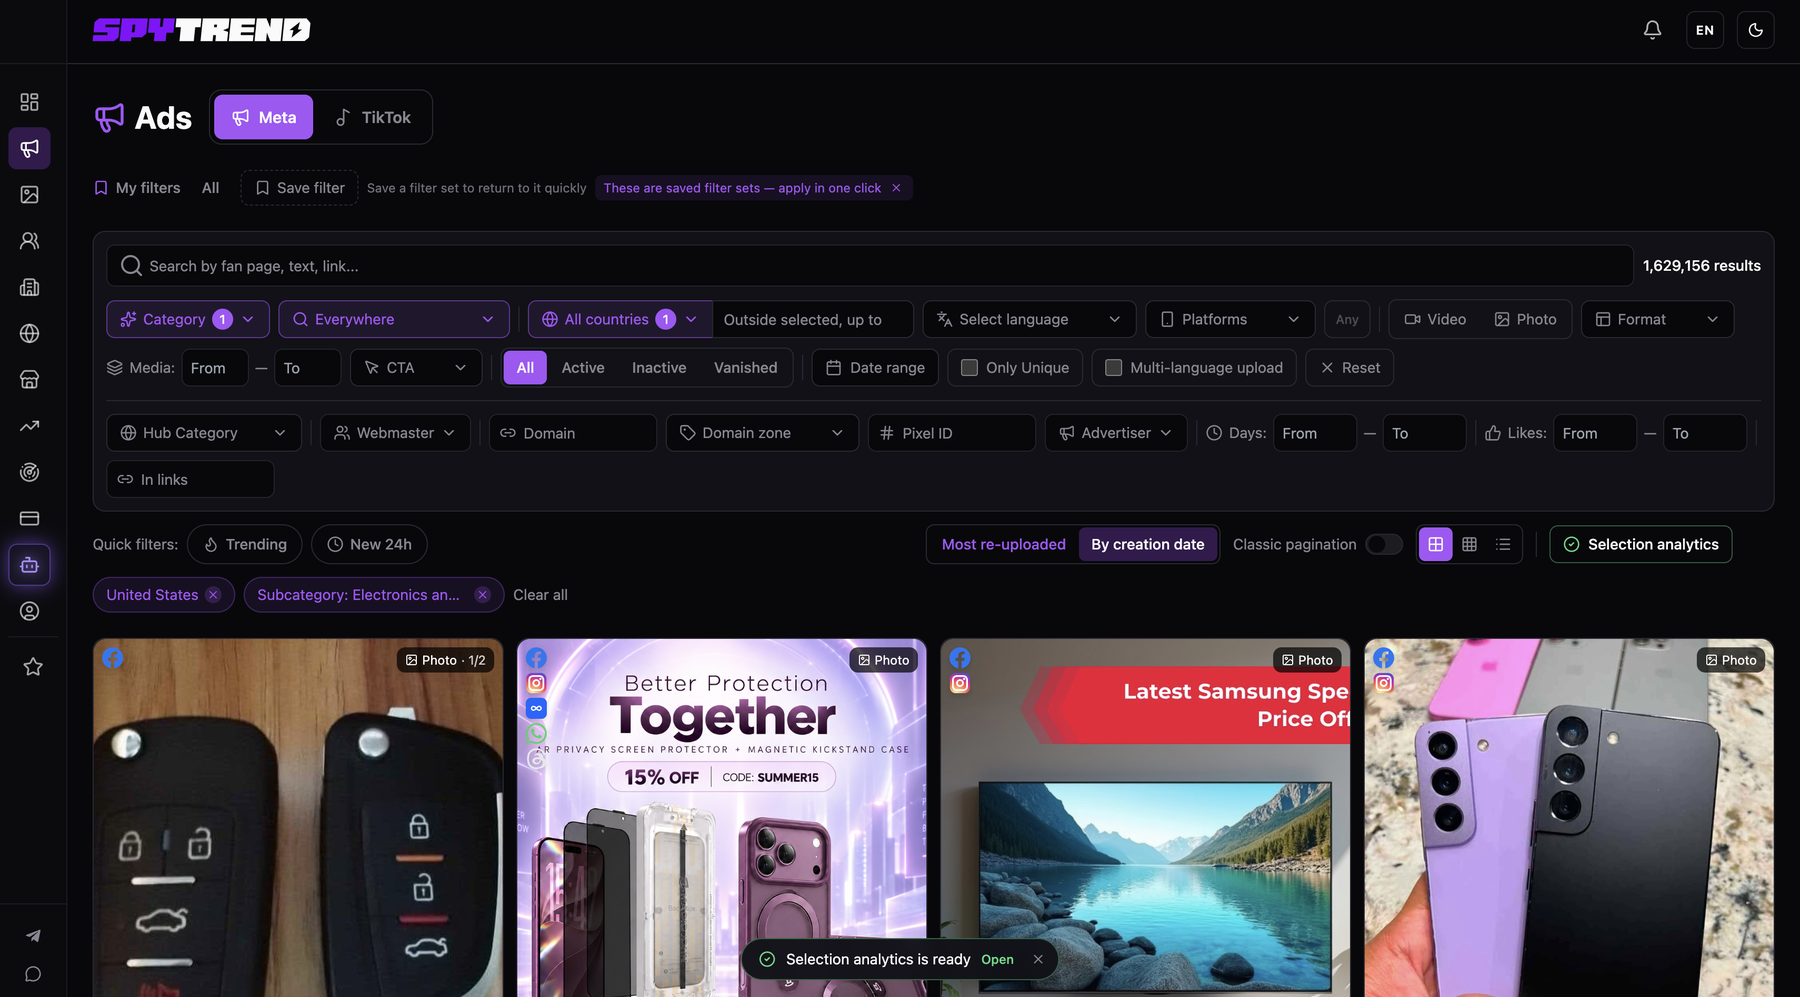
On its own, that number doesn't help you. It's the total a trending-products list is built on, before anyone asks how many of those ads are still paid for. Every step after this one cuts it down to the part that means something.
Step 2. Filter by Days Active
Next I set the days-in-flight filter to 30 and re-read the same list. What remains has been carried through roughly a full budget cycle. Nothing survives a budget cycle by accident. This one control removes most of what a trending-products list would have handed you.
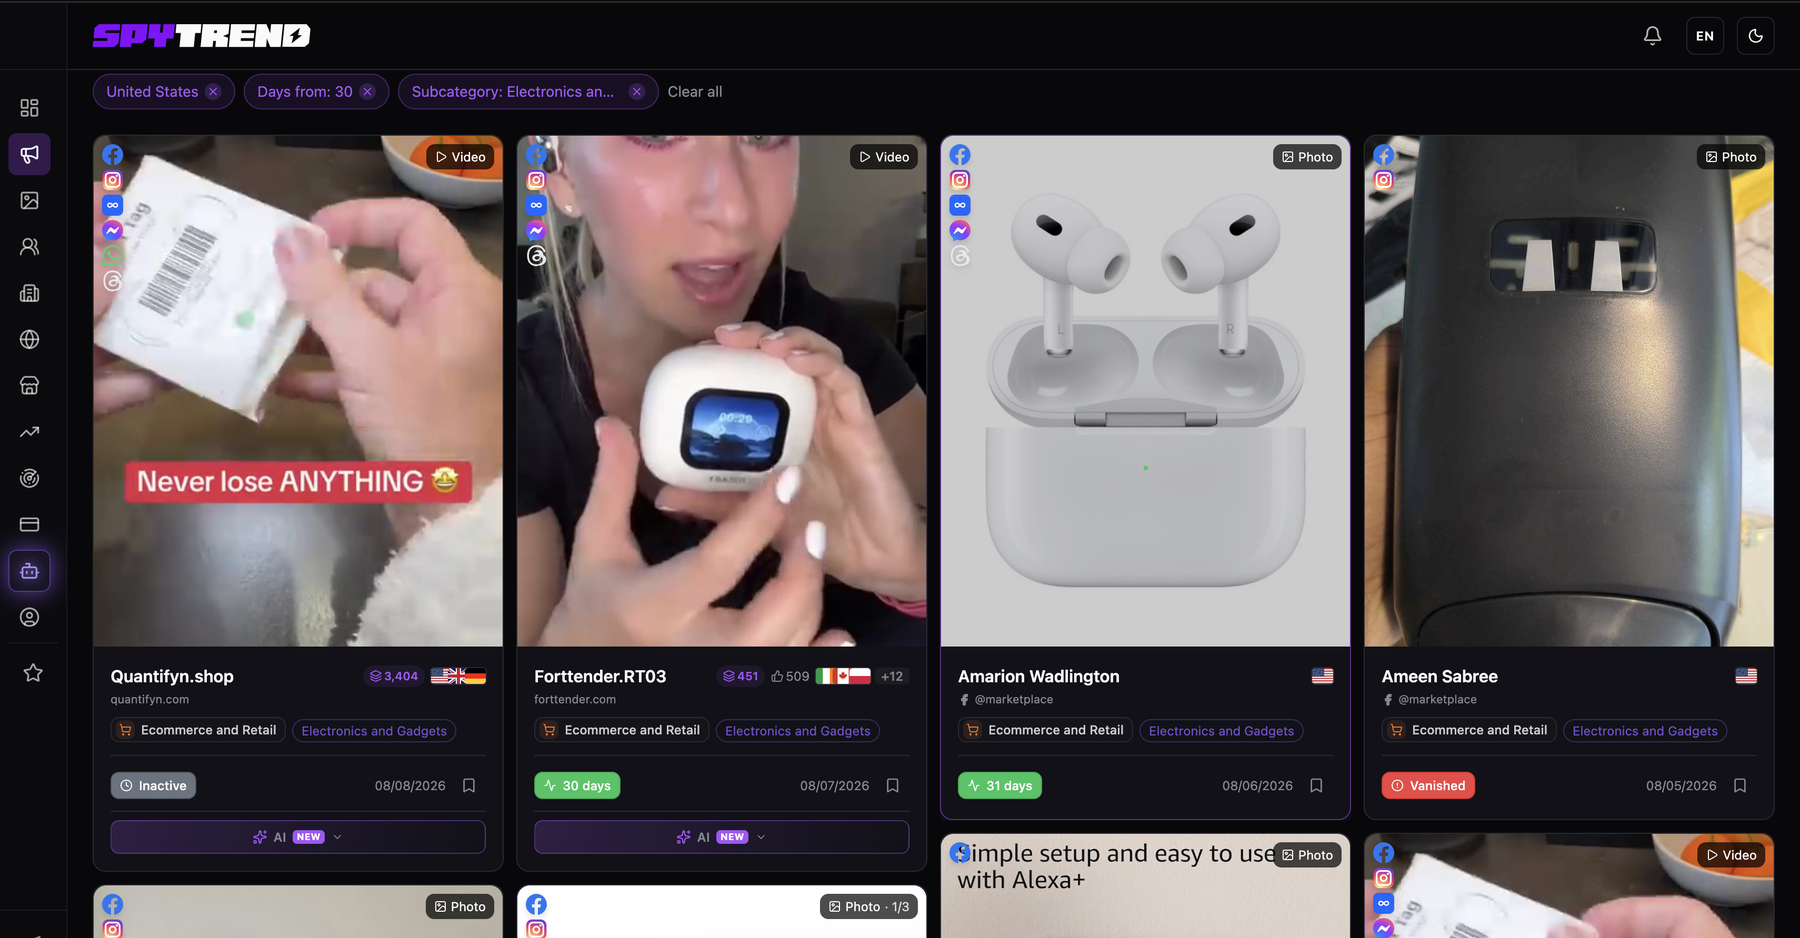
Read the badges together. Each card shows three things at once: days in flight, whether it's still live, and how many times the creative has been re-uploaded. In the row above, one advertiser sits at 3,404 re-uploads and another at 451. That's the second signal, and it's the harder one to fake. Longevity can be neglect. A re-upload is always a decision.
Raise the threshold when a category is crowded. Lower it when you're hunting for something new and can live with less certainty. Here's what each cut proves:
| Days Active | What it proves | When to use it |
|---|---|---|
| 7+ | A lead, not proof | Hunting for something new |
| 30+ | Survived roughly one budget cycle | Default cut for any vertical |
| 60+ | A strong claim, even in a seasonal vertical | Crowded categories |
| 90+ | Closer to a business than a campaign | Choosing what to beat, not what to test |
Step 3. Read the angles
Once the list is filtered down, the thing that repeats is rarely the product. It's the angle: the problem the first three seconds name, the demonstration, the before-and-after, the price framing. Duplicates collapse into one card in Creatives. A creative that many pages run shows up once, with the count attached. You don't see hundreds of separate ads that look like hundreds of separate advertisers.
I opened one video card. It carried 4,387 ads, and 406 of them were still live on the day I took the screenshot. 83 advertisers ran it across 65 different owners, and its longest continuous run was 87 days.
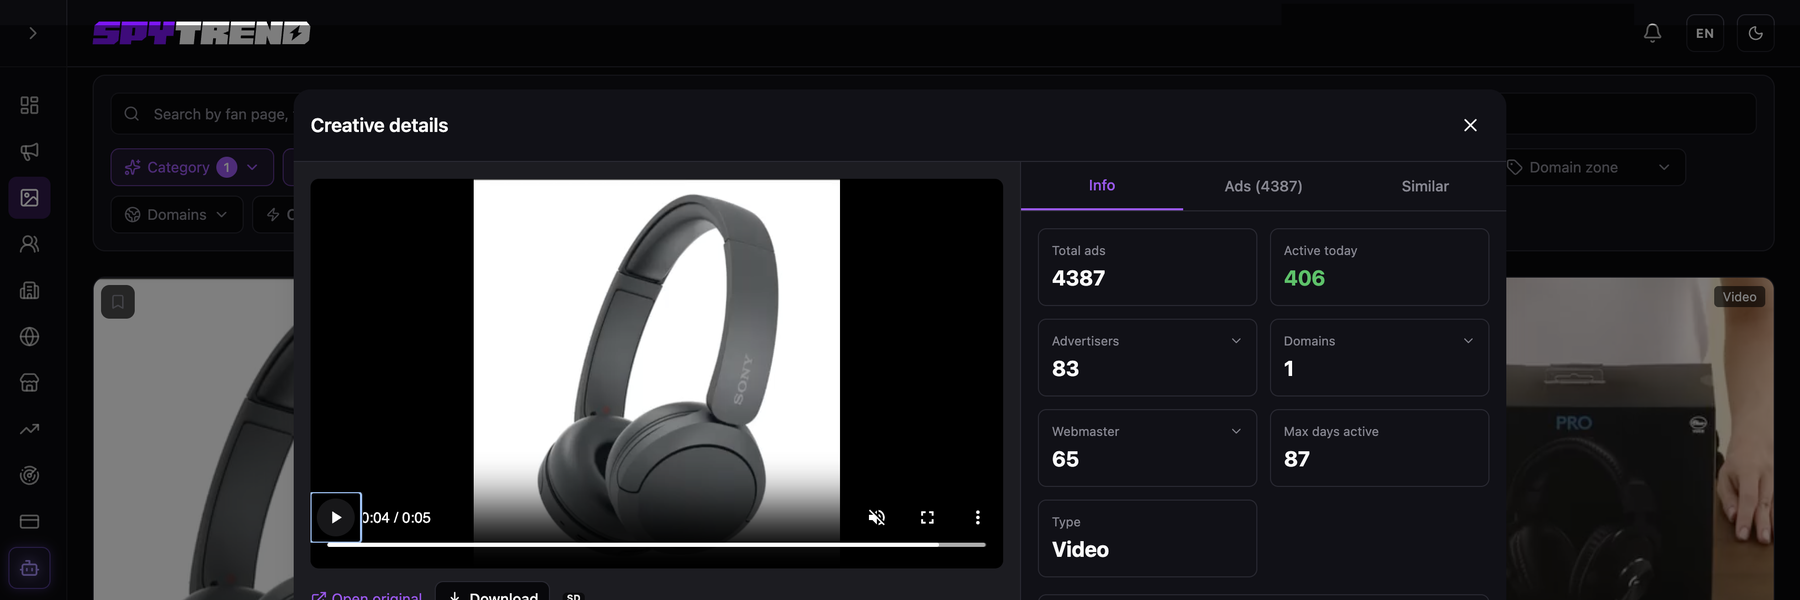
Sixty-five separate owners paying to run the same footage isn't a coincidence or a trend report. It's the market voting with budget on one specific way to present a product. That owner count shows how proven an idea is. The raw number of ads doesn't. So what do you take away? The angle, rebuilt with your own footage and your own offer. If you lift the file itself, your ad competes against its own original in the same auction.
Step 4. Read the whole vertical in one line
Before committing, I read the category as a single row of numbers instead of a wall of cards. The country breakdown does that. It answers a question a product list never touches: how much room is left.
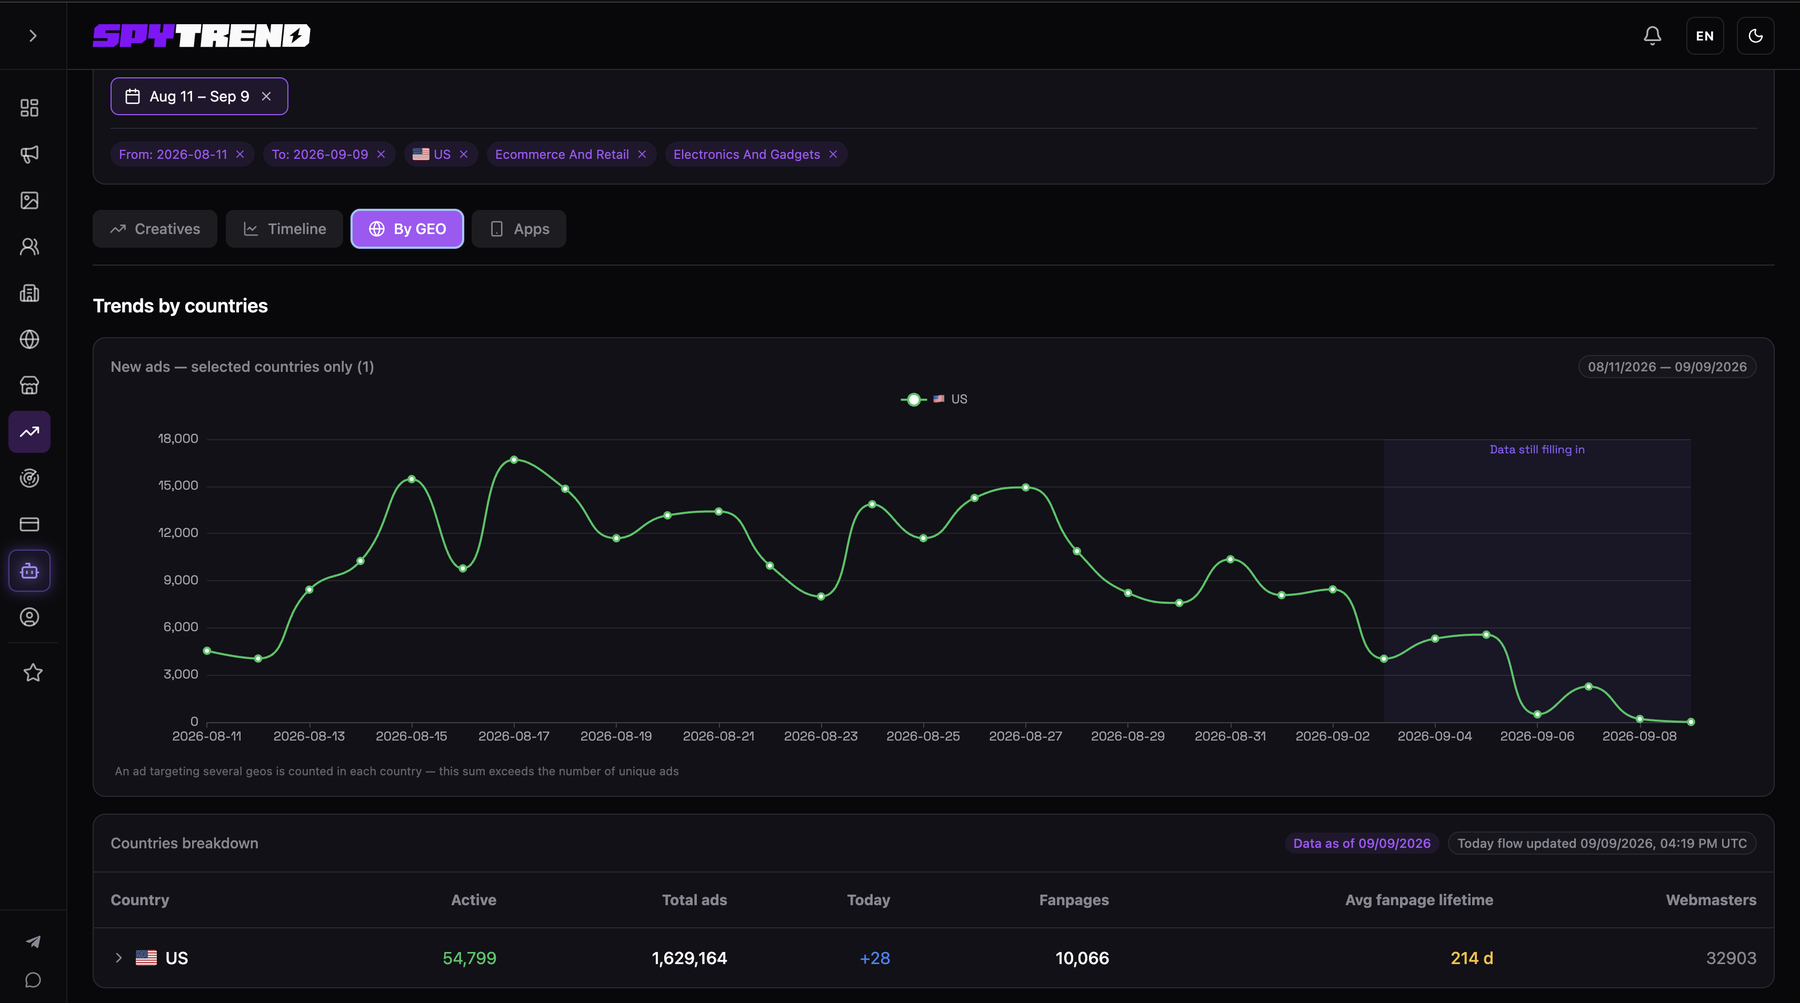
Two readings matter here. First, the survival rate. 54,799 ads still active out of 1,629,164 ever recorded is about three in a hundred. That ratio is the honest version of the category. Hold it against any list that calls a product a winner.
Second, average fanpage lifetime, 214 days. Where pages die young, the market is aggressive and heavily policed. Where they live long, incumbents are stable. A newcomer then needs a real differentiator, and a lower price won't be enough. Seven months reads as a settled market. Neither reading is a reason to avoid a vertical. They do call for very different budgets.
For timing, compare one period with the one before it. A single snapshot won't show you the direction. A vertical that has doubled its new-ad count in a week is either seasonal or being discovered. Either way you're late by days, and that kind of late is survivable. Trends is built for that comparison.
Step 5. Take one operation apart
This step changes decisions, and it's the easiest one to skip. When five stores in one vertical advertise the same item, it reads as five independent confirmations that it sells. Often it's one operator with five domains.
The Webmasters section clears up that picture. It assembles one owner's ads, domains, pages and pixels in advance, across three axes at once, broken down by country. So "how many businesses are really in this niche" gets an answer instead of an estimate. Five domains under one owner count as one confirmation. That single correction can flip your decision on the product.
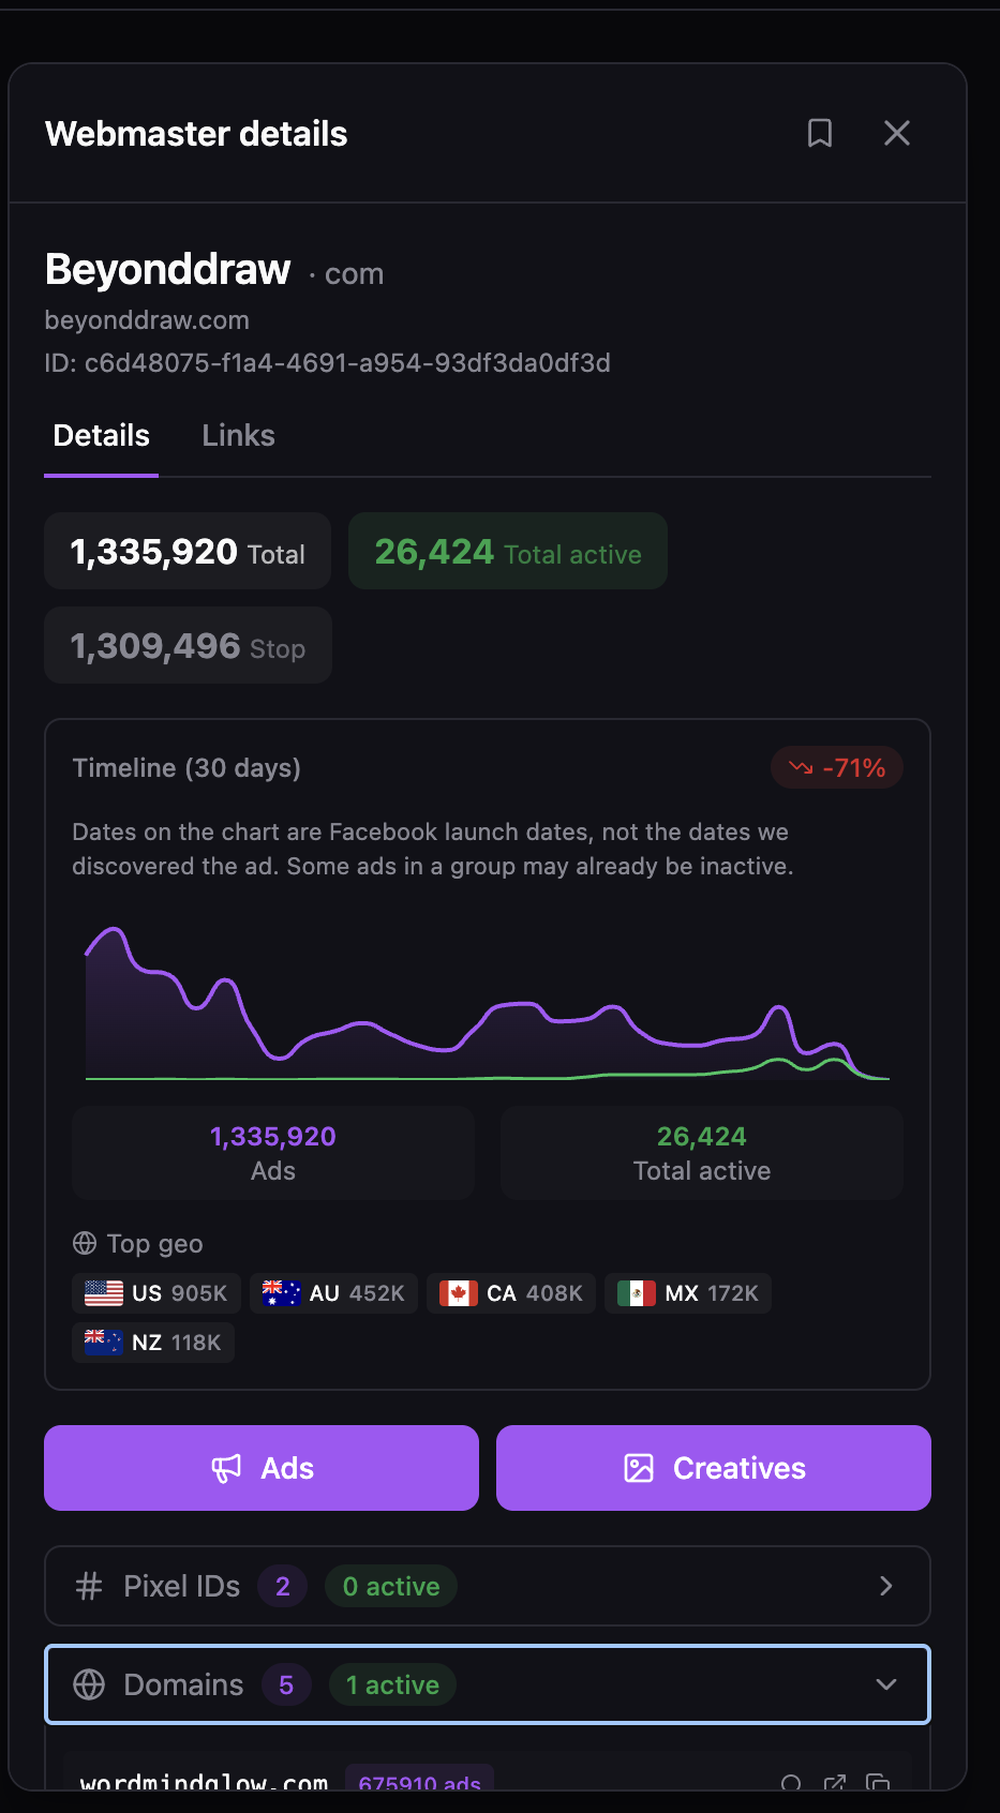
I opened the card of one owner in this vertical, and the active-to-stopped ratio is the second read. This operator keeps about two ads in a hundred alive. That means heavy testing, a narrow set of survivors and a thirty-day trend pointing down. Mostly stopped means someone is still searching for the right creative. Mostly active means they've found one and are funding it. Those two sit at very different stages and call for different responses. In a plain ad feed they look the same. The Webmasters view is where you can tell them apart.
Then I moved from the advertiser to the shop. A store page carries what an ad never shows: monthly visits, growth against the previous period, the share of traffic that's paid, and the active ad count set against that traffic.
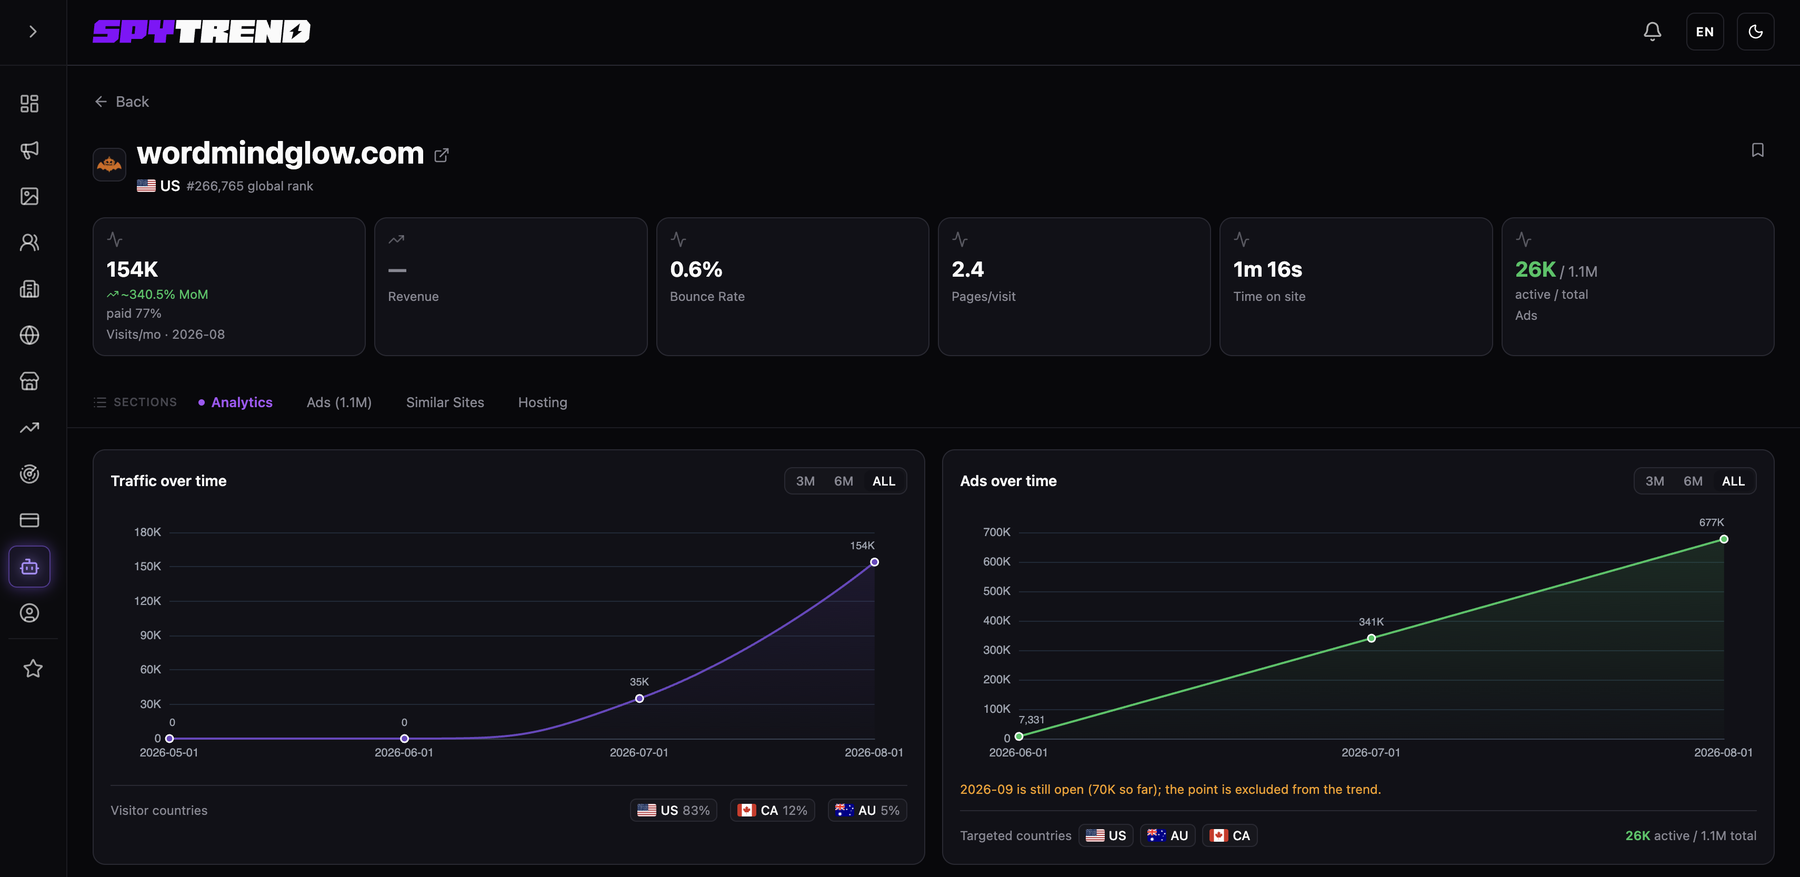
Seventy-seven percent paid traffic is the number to keep. Almost nothing here arrives on its own. The store lives or dies on the ads above it, and its profit margin has to pay for every one of them.
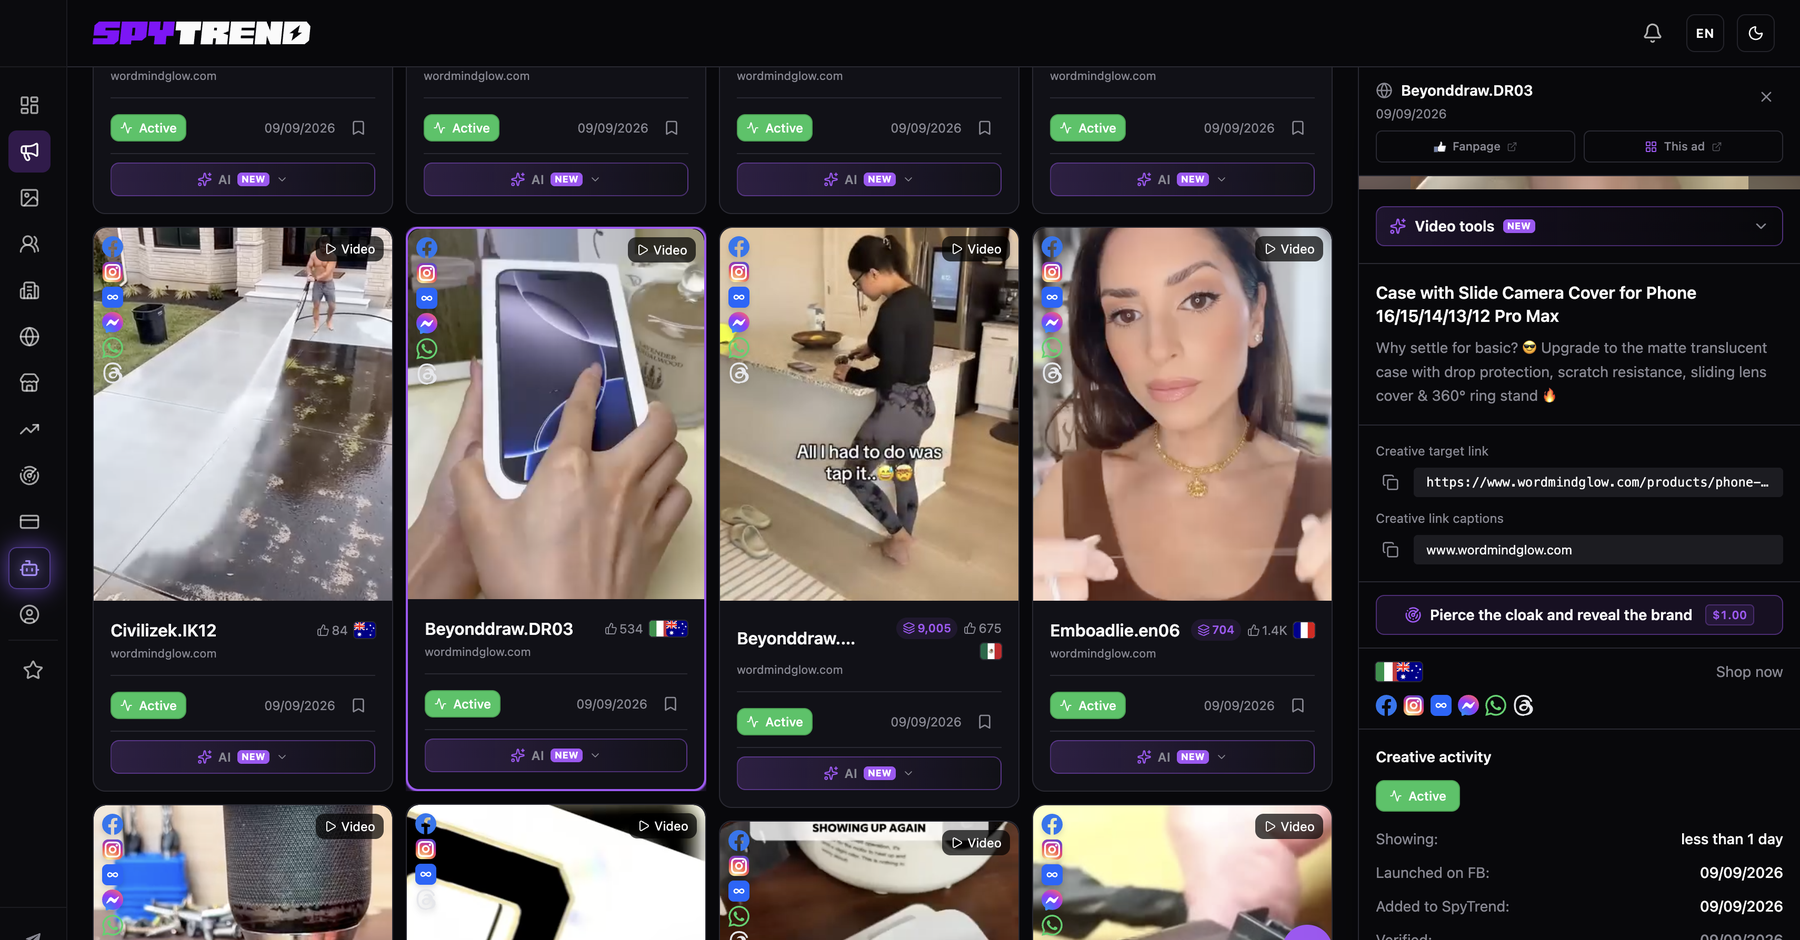
The last stop is the page a buyer actually lands on. What a crawler is shown isn't always what a customer in a given country is shown. The offer, the price and the guarantee exist only on the real page. The ad card shows the declared link, with a control underneath that fetches the real page. It costs $1 per run on any plan, for any link, refunded if the run fails. That's where "can I compete on this offer" stops being a guess.
The twenty-minute version
Once the sequence is familiar, it gets shorter. This is the weekly routine, short enough to run before you commit to any product:
- Filter the category and country you are considering, and read the raw count.
- Set Days Active to 30 and write down both counts — before and after. The gap is the category's real hit rate.
- Open the creatives that survived and name the angle each one uses.
- Check the country breakdown for a market that is still open rather than merely large.
- Group the surviving advertisers by owner and count the operators.
- Open the store behind the strongest operator and compare its traffic against its ad volume.
- Pull the real landing page for the one offer you would have to beat.
Seven steps, one sitting, and you end up with a decision you can defend to whoever is funding it.
Starting without paying for anything
On the free Starter tier the ads are three months old and the mode is limited. That's still enough to walk the whole sequence on a vertical you already know and see whether the sections fit how you work. Try it: set your country and category, read the raw count, then set Days Active to 30 and see what's left. Once the check turns weekly, the plans are compared side by side on the pricing page. For the wider picture of what this class of tool does, the ad spy tools overview covers it.
FAQ
What is a dropshipping automation platform?
A dropshipping automation platform is software that connects a store to its suppliers and automates what happens after a sale. It imports products, sends orders to the supplier, syncs tracking back to the customer, applies pricing rules and keeps stock counts accurate. It runs the operation. Choosing the product is still your job.
Dropshipping automation platform: can it tell you what to sell?
A dropshipping automation platform can't tell you that reliably. Its catalog rankings measure what other sellers are importing, and that's demand from dropshippers. Evidence of consumer demand comes from the open ad market. Look at which products are being advertised, for how long, and by how many truly separate operators. Check those before you trust a catalog ranking.
How long does an ad have to run before the product is worth trusting?
Thirty days of continuous delivery is the usual working threshold. That's roughly a full budget cycle, and losing ads tend to be switched off within a week or two. Sixty or ninety days is a stronger claim. Below seven days you have a lead. It isn't proof yet.
Five stores are advertising the same product. Does that prove demand?
Only if they're five different businesses. Grouping ads, domains, pages and pixels by owner often turns a crowded-looking niche into one operator running several storefronts. In the example above, five domains sat under a single owner. That's one confirmation instead of five, and it leads to a very different decision.
Do I need a paid tool to research a dropshipping vertical?
The free ad libraries are the right place to start, and every seller should be able to work in one. A paid tool earns its cost when the research turns systematic. That means a whole category instead of one brand, and evidence that an ad actually works beyond being live. It also means seeing the operation behind an ad.