In short: high demand products to sell are the ones buyers keep paying for. From outside, the clearest trace is a seller who keeps paying to advertise them. Look for ads running for months, a creative reused by many sellers, fresh launches this week and several owners behind them.
Why "high demand" is hard to see from the outside
Most lists of trending products are guesses about somebody else's sales. Search volume shows curiosity. A viral video shows views. Neither shows that anyone bought, and a product can trend for a week on novelty alone.
Advertising leaves a different trace, because it costs money every day. A seller who keeps an ad running for months, or launches the same video thousands of times, is spending real budget on that product. Run length and launch counts are signals you can read without seeing anyone's books.
There's a catch. One large seller can make a product look popular on its own by running many storefronts with the same video. So the question has two parts. Is money being spent on this product? And by how many separate owners?
High demand products to sell on Amazon: what the marketplace shows for free
Amazon publishes its own demand lists, and they're worth a look before any paid research. Best Sellers is introduced as "our most popular products based on sales", and each department gets its own ranking. Movers & Shakers shows the biggest gainers in sales rank over the past 24 hours. Both pages carry the same note, "Updated frequently", without an exact schedule.
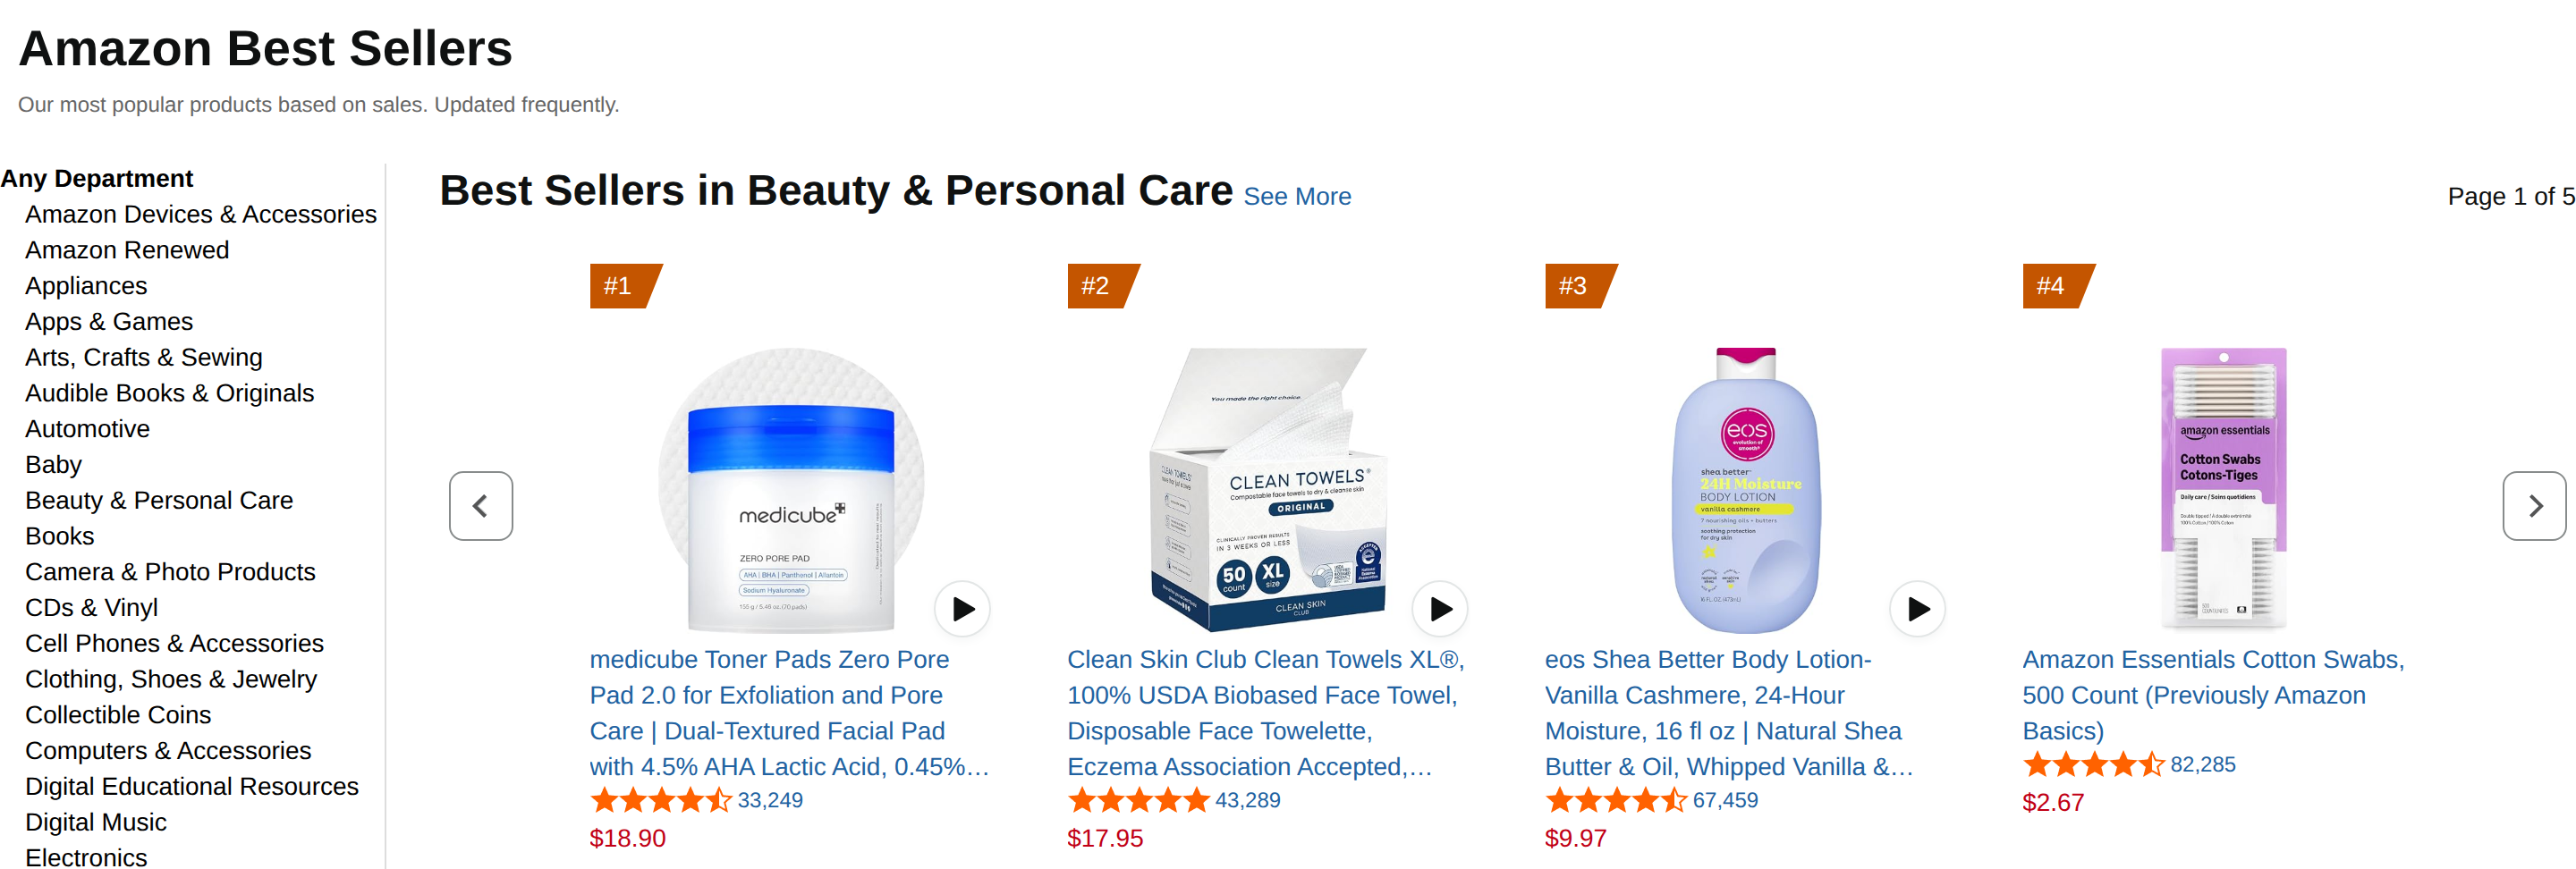
The Movers & Shakers page explains its maths with an example. A music item ranked 30 twenty-four hours ago and ranked 10 now gets an increase of 200%. So Best Sellers shows where a product stands, and Movers & Shakers shows how fast it is climbing.

These lists show what sells on Amazon right now. They say less about the question a store owner or media buyer usually has: what will sell through my own ads? A product that ranks on Amazon has Amazon's search traffic, reviews and delivery behind it. Pushed through a Facebook or TikTok ad to a standalone store, it faces a different test. It has to stop a scroll and earn a click to an unknown shop.
That's why the rest of this guide reads demand through ads. The numbers come from Spytrend, mostly for the United States.
Four demand signals in ad data
Each signal shows a different side of demand, and none of them is enough alone.
| Signal | Where it shows | What it says about demand | Example from this guide |
|---|---|---|---|
| Spike | Trends, compared with yesterday | Sellers started launching the product this week | Oil sprayer: 168 ads, 87 of them added in the period, 2 new fan pages |
| Persistence | Creative card, Max days active | Someone kept paying for the product for months | "Shorten pants" video: 209 max days active, 270 ads active today |
| Breadth | Creative card, Advertisers and Domains | Many sellers bet on the same product | The same video: 214 advertisers, 178 domains |
| Owner concentration | Webmasters | Whether many stores are many sellers or one | Trysoviren: 19 domains under one owner |
A product that shows the first signal alone is news. Once persistence and breadth line up, it starts to look like demand. The fourth signal tells you how crowded that demand already is.
How to find high demand products with ad data
- Open Trends, choose your product categories and a country, and look for creatives exploding against yesterday.
- Open the card of a creative that has lasted: max days active, active today, advertisers and domains.
- Count the owners behind those pages in the Webmasters section before you call the market open.
- Open the real landing page of the strongest candidate to see its price, offer and bundle before you order stock.
Step 1. Catch what's spiking this week
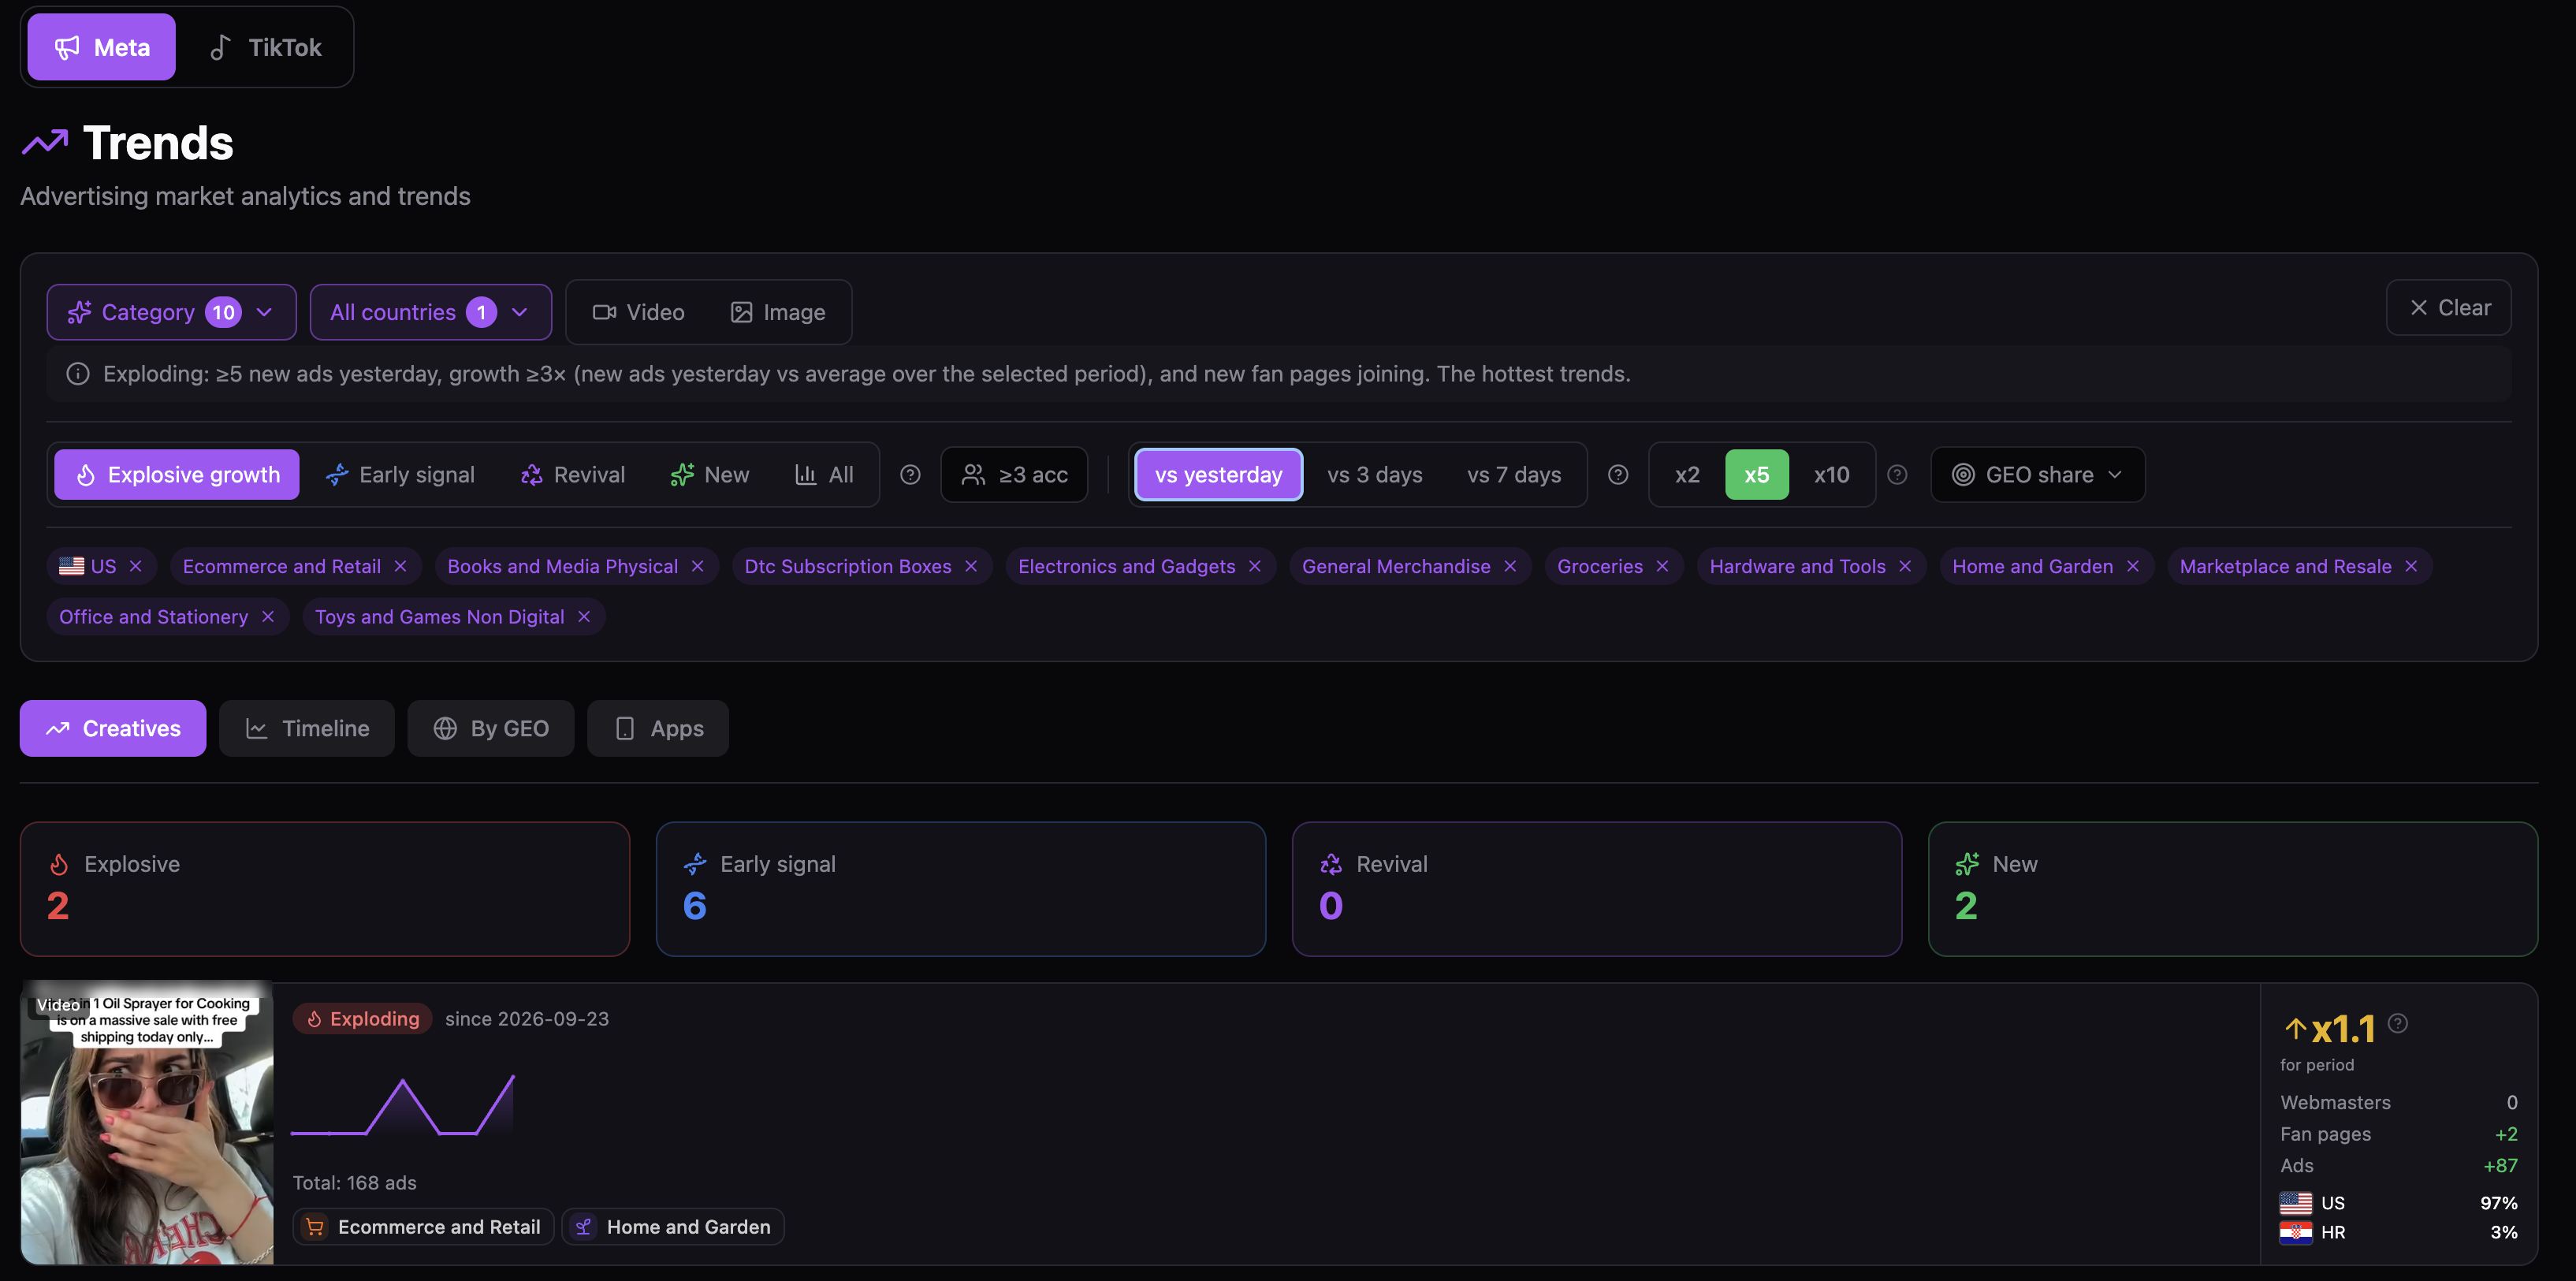
Trends is the quickest place to see a product catching on. Set it to compare with yesterday at x5, and the list gets short on purpose. Across ten e-commerce subcategories in the US it returned two explosive creatives and six early signals. The screen spells out the rule: at least five new ads yesterday, growth of 3x or more against the period's average, and new fan pages joining.
The first result is a kitchen oil sprayer sold in a reaction-style video. It has 168 ads in total, and 87 of them were added in the period. Two new fan pages picked it up, and 97% of its ads target the US.
A few days of launches isn't proof of demand. It tells you sellers are testing the product right now. Step 2 looks at a product where that testing has paid off for months.
Step 2. Read the card of a product that lasted
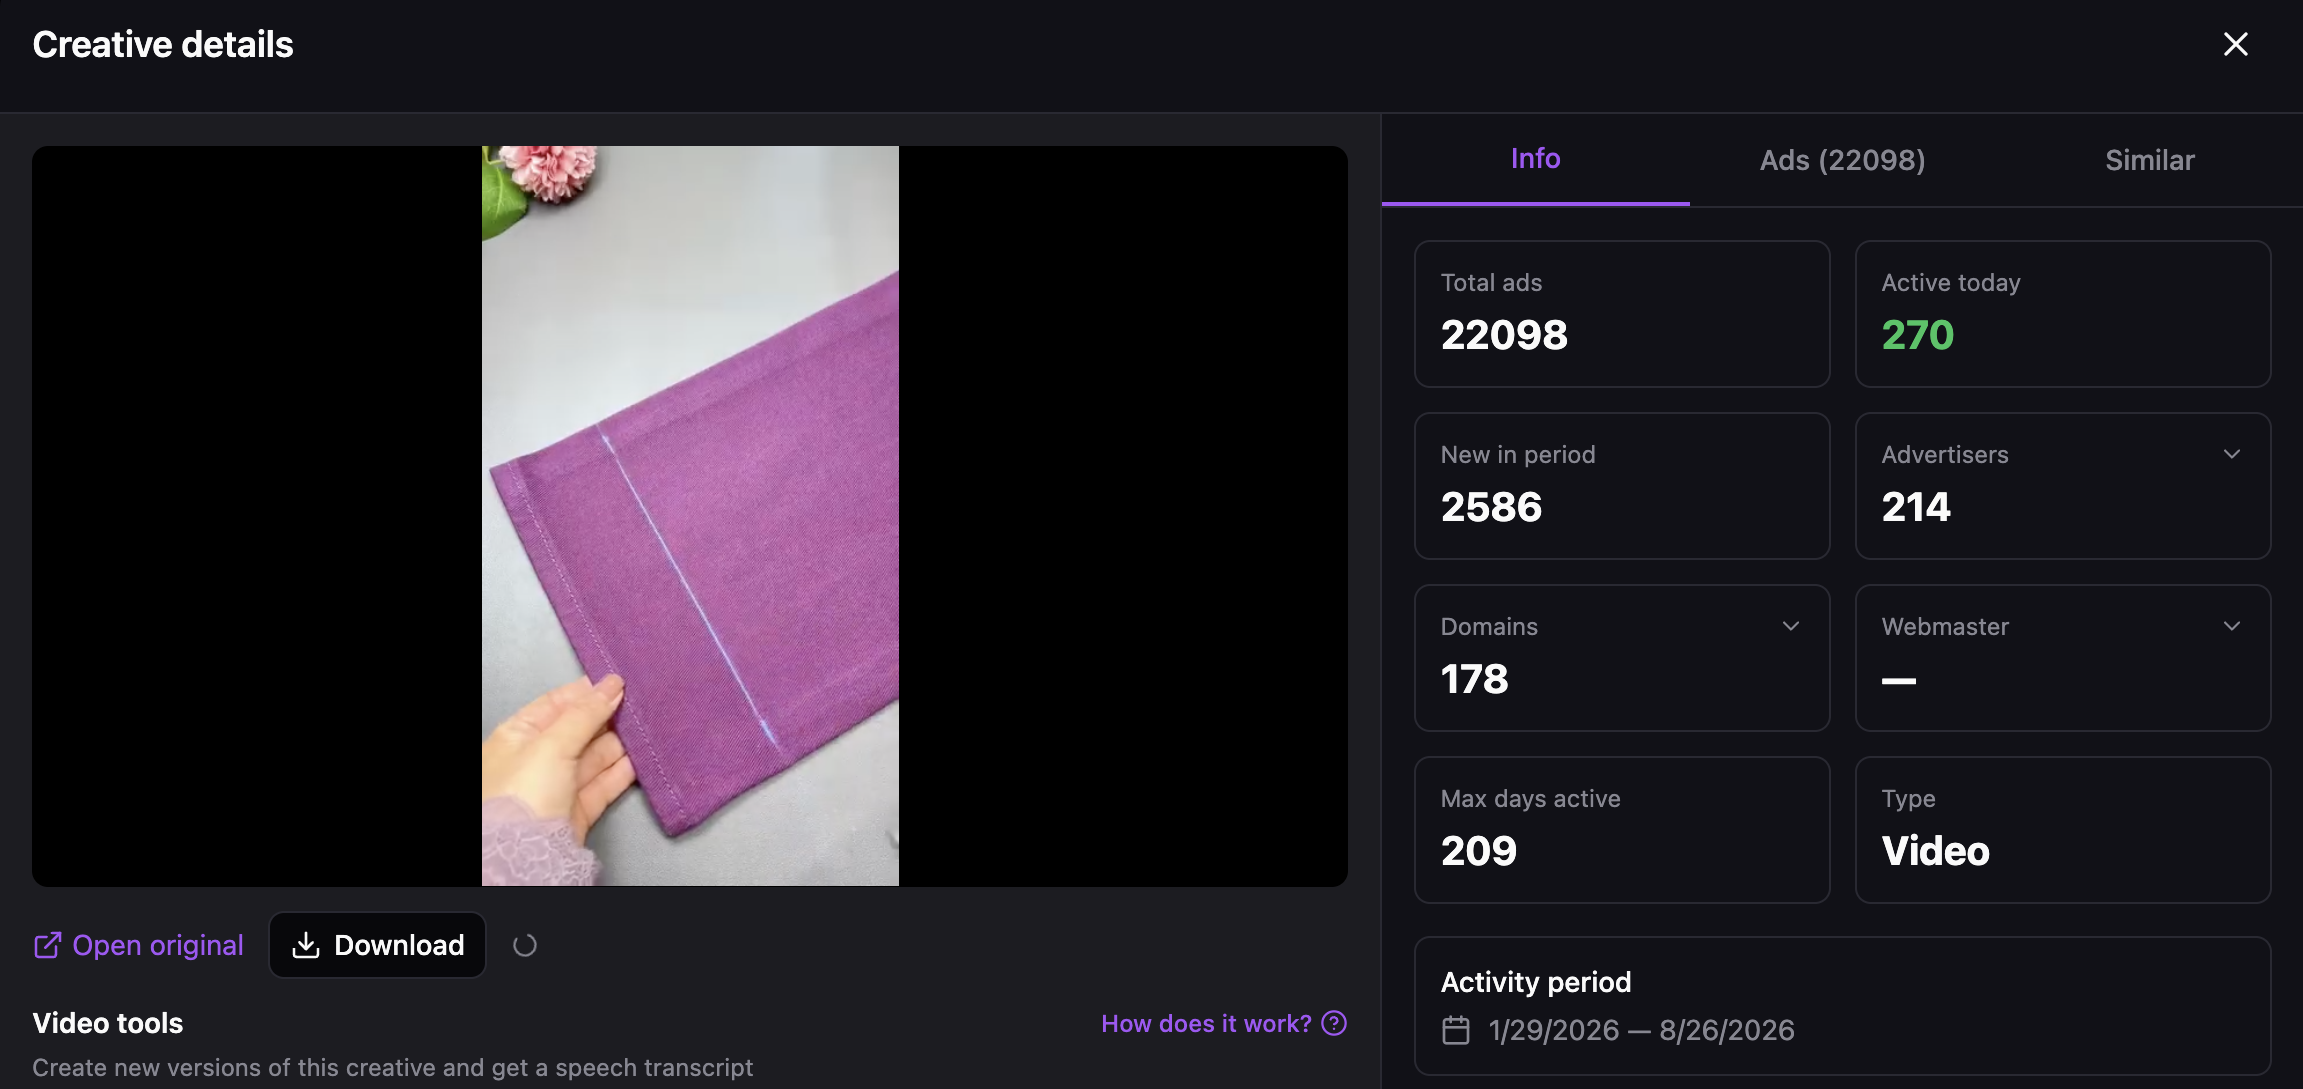
This is what sustained demand looks like on one card. A short video shows a pair of purple trousers being taken up. It has been launched 22,098 times by 214 advertisers across 178 domains. The card's max days active reads 209, and 270 of its ads were still live.
Three of those numbers matter for a buying decision. Max days active shows that at least one seller kept paying for this product for about seven months. The domain count shows it isn't one store's secret: 178 different sites received traffic from this video. And 2,586 new launches in the period show that sellers are still adding it.
The Webmaster field on this card is empty, so the card alone doesn't say how many owners stand behind those 214 advertisers. That's the check in step 3, covered in the Webmasters section below.
Step 3 and step 4. Owners, then the landing page
Count owners before you count stores. The section on Webmasters below shows how one owner can sit behind many domains.
Last comes the landing page itself. Its price, bundle and delivery promise decide whether you can compete with the sellers you found. When a redirect hides that page, Spytrend can open the real one for $1 per run, and a failed run is refunded.
Where ad data stops
Ads prove that money is being spent. They don't prove it's being made. A product can stay funded for months while a seller keeps testing, or while a brand pays for reach on a thin margin. Spytrend shows how long and how widely a product was advertised. Spend appears only as a from–to estimate, and sales aren't visible at all.
A few more limits are worth keeping in mind:
- Max days active belongs to the longest-running ad. The same video may have failed in dozens of shorter attempts first.
- A spike in Trends can be one seller launching many ads at once. Check how many pages and owners joined, as well as how many ads appeared.
- Demand is local. A product that sells in the United States can flop in Germany, so every step above starts with a country.
- Paid social is one channel. A product that sells mainly through Amazon search or Google Shopping will look quieter in ad data than it is.
Use all this to build a shortlist to test. Two or three products with long runs, many sellers and fresh launches are a better bet than one viral video. A small test budget will tell you the rest.
What the Webmasters section adds
The costliest mistake in product research is counting stores instead of sellers. Twenty stores running the same product look like an open market. If one operator owns all twenty, you're about to compete with someone who already knows the product's numbers.
In Spytrend, the Webmasters section files every ad under the webmaster who runs it. One panel links that owner's pixel, domains and pages, with a split by country. Here it is on a fashion seller from the same US research.
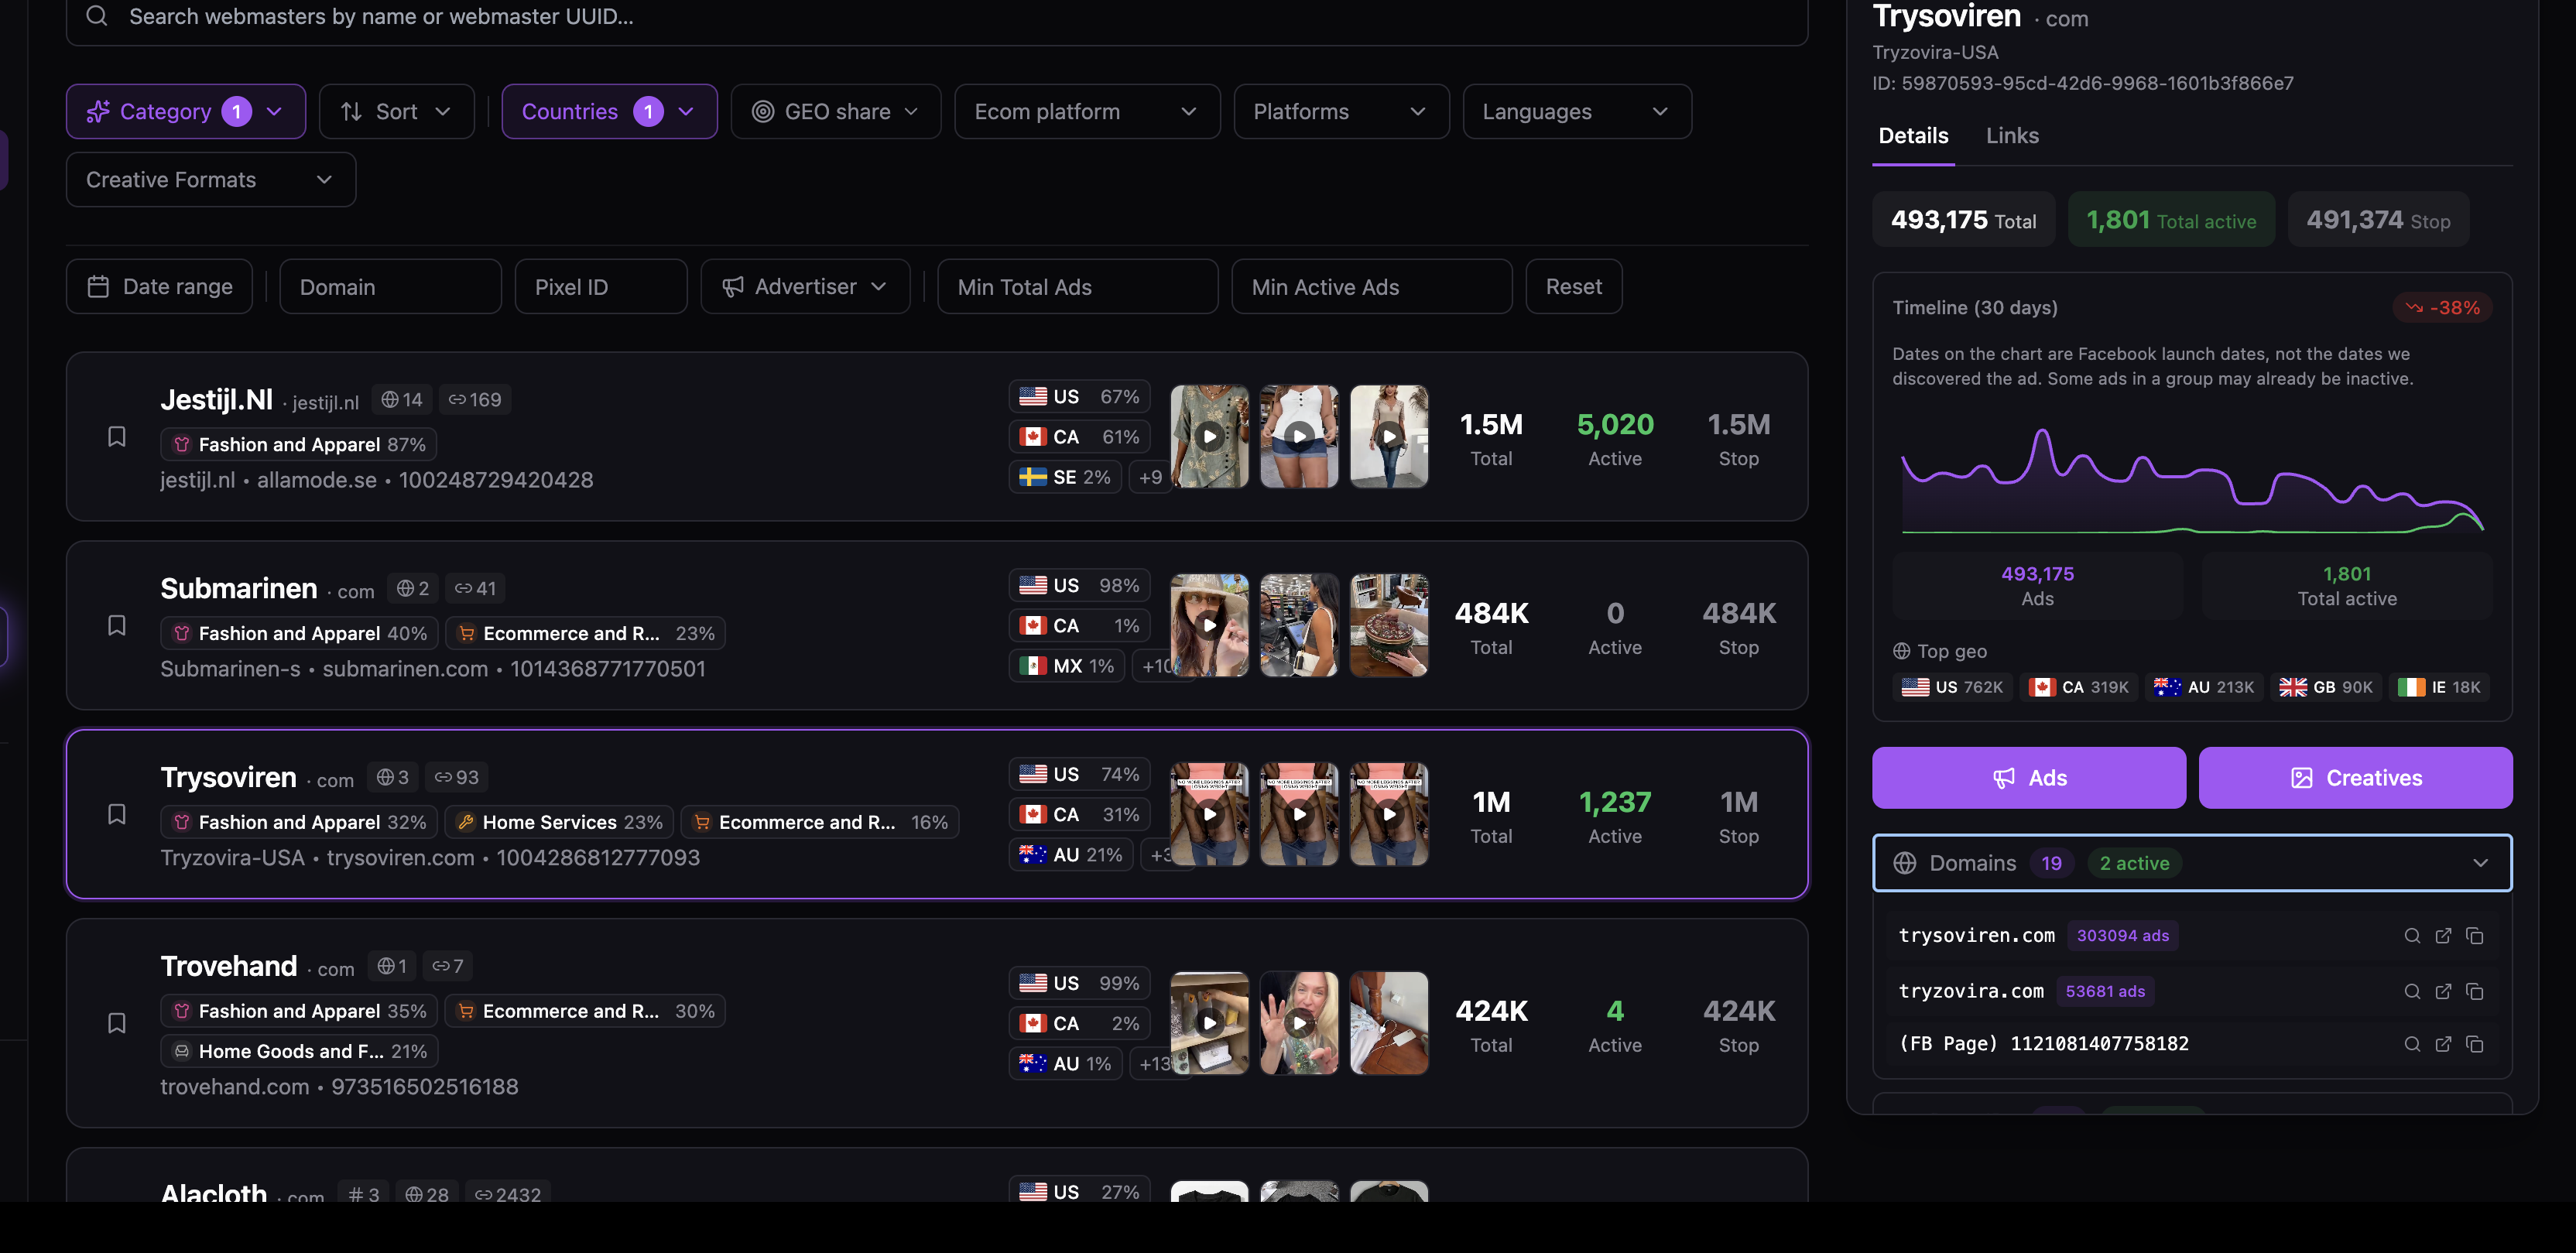
Trysoviren advertises clothing, home services and general retail. Most of its ads target the US, Canada and Australia. On the panel it's one owner with 19 domains, two of them active, and almost half a million ads. Its 30-day timeline is down 38%.
Say a product you're researching shows up on several of this seller's domains. That's one seller's catalog, even if it looks like several confirmations of demand. The list beside the panel shows other large fashion sellers in the same market. One screen tells you whether a category is split among many owners or held by a few. The Webmasters write-up on the Spytrend blog covers how the grouping is built.
All three Spytrend screens in this guide come from a product its makers define like this: Spytrend is an ad intelligence platform for Facebook and TikTok advertising: an archive of ads going back to 2018, AI-classified into 33 business categories, with every advertiser assembled into a single card — all ads, pages, domains and countries in one place.
Behind that sit more than 1.4 billion Facebook ads and 342 subcategories, filterable across 193 countries. Starter costs nothing and takes no card, with access to ads three months and older. That's enough to practice these signals on a niche you know. For this week's spikes you need a paid plan, and the pricing page compares them. Picking a niche before a product is covered in the guide to profitable dropshipping niches. The search process itself, step by step, is in the guide to product finder tools.
FAQ
High demand products to sell: what's selling right now?
High demand products to sell change with the country and the month, so any fixed list goes stale fast. In the US data behind this guide, a kitchen oil sprayer was exploding in Trends, and a pant-shortening video had one ad live for 209 days. Check current data for your own market before you buy stock.
How do I know a product has real demand, not just hype?
Look for three things together: ads that run for months, many independent sellers using similar creatives, and new ads still being added this week. Hype usually shows only the third. A product with long runs across many owners has already passed several sellers' own budget tests.
High demand products to sell on Amazon: will they sell in my own store too?
High demand products to sell on Amazon sometimes work in a standalone store as well. Amazon's lists show what sells with Amazon's traffic, reviews and delivery behind it. In a standalone store you need an ad that stops the scroll and a reason to buy from an unknown shop. Cross-check an Amazon winner against ad data before you commit money to stock.
How long should an ad run before it signals demand?
Thirty days is a practical minimum, because most failing tests are switched off within a week or two. Two to three months of continuous running is a strong signal. Keep in mind that run length shows a seller kept spending. It doesn't show the size of the profit.
Can one seller make a product look popular?
Yes, and it happens often. An operator with many storefronts can launch the same video from dozens of pages. Grouping pages by owner shows whether twenty stores are twenty competitors or one, and that changes how crowded the product really is before you decide to enter.
Does Spytrend show product sales numbers?
No. It shows advertising: how many times a creative was launched, for how long, by how many pages and owners, with spend as a from–to estimate. Sales stay private to the seller. Treat ad data as evidence of paid demand, and confirm it with a small test of your own.