In short: Profitable niches for dropshipping share three signs. Ad volume holds up for weeks. A meaningful share of the ads survive 30+ days. More than one operator funds the category independently. You can check all three in ad data. A “trending niches” roundup can't show any of them.
Course sellers publish “profitable dropshipping niches for 2026” lists each year. The same five or six categories keep coming back: pets, home fitness, kitchen gadgets, skincare tools. That repetition doesn't prove each one is still a profitable dropshipping niche. It shows the list gets copied forward faster than the market inside it changes. A profitable niche for dropshipping this month may not be the one that was profitable when the list was first written. The only way to tell is to look at what's being advertised right now.
This page is the niche-level version of that check. Product-level research answers a narrower question: is this one product still selling, once you already have a candidate? That workflow is in what a dropshipping automation platform does not do for you. A wider question comes first. Is the whole category worth entering, given how many people already fund ads in it and how long those ads last? The workflow below answers it one level up from a single product. It uses the same ad data in Spytrend. The company describes it this way: Spytrend is an ad intelligence platform for Facebook and TikTok advertising: an archive of ads going back to 2018, AI-classified into 33 business categories, with every advertiser assembled into a single card — all ads, pages, domains and countries in one place.
How I checked the niche signals
I ran each step below in Spytrend and took a screenshot of what came back. The screens cover the ecommerce vertical, and most of them narrow it to Electronics and Gadgets. For the operator example, I followed one store's ad feed to the owner behind it.
What this check doesn't show: each screen is a single snapshot, and the numbers have moved since. It covers one vertical, mostly one electronics slice. I followed one store to its operator, so this isn't a full operator count for any category. Ad data also can't show your margin or supplier price. Those still decide whether a niche pays you.
What's actually running in dropshipping right now
A “profitable dropshipping niche” list built once and read for a year treats the market as static. It isn't. Categories cool off and heat up within weeks. A list that isn't rebuilt at that pace describes last quarter.
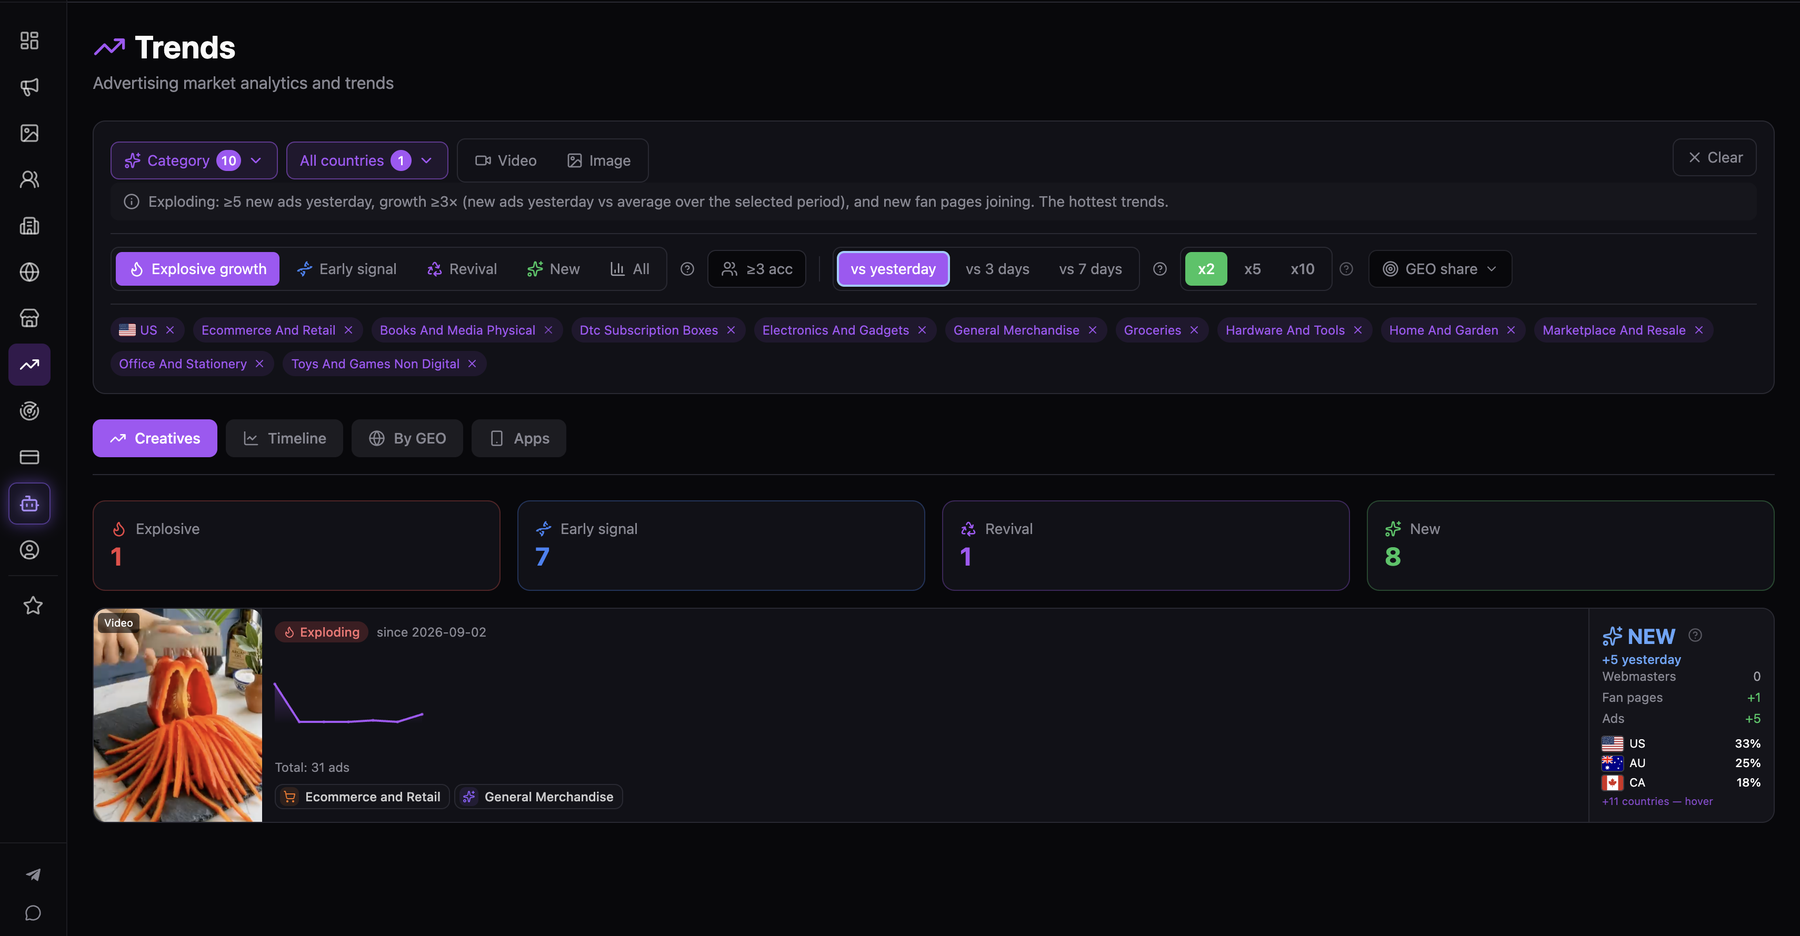
In Spytrend, the Trends view reads the current state straight from ad counts. The Explosive growth preset surfaces categories whose ad volume has multiplied over the last few days. That's new sellers piling into something that works right now. The Early signal preset catches categories that are just starting to move. At that point there isn't enough volume for anyone to write a roundup about them. Both presets read off actual ad counts, and that's the advantage over a list. A list can only describe a niche that peaked long enough ago for someone to notice and publish it.
I ran Trends across the whole US ecommerce vertical, ten subcategories at once, compared with the day before. It returned one creative under Explosive growth, seven under Early signal, one under Revival and eight brand new. So what does that ratio tell you? Seven early signals against one confirmed explosion means most of what looks like a rising niche is still unproven. Eight new entries in a day means the picture changes too fast for a list you write once a year and read for twelve months. The one explosion sat in General Merchandise. It wasn't in any category a niche roundup would have named in advance.
The typical approaches and creative formats
Inside any category label sit a handful of narrower sub-niches. They don't all perform the same way at the same time. “Home and Garden” can be flat overall while one sub-angle inside it, say outdoor lighting or compact composting, carries most of the growth. A category-level number hides that split completely.
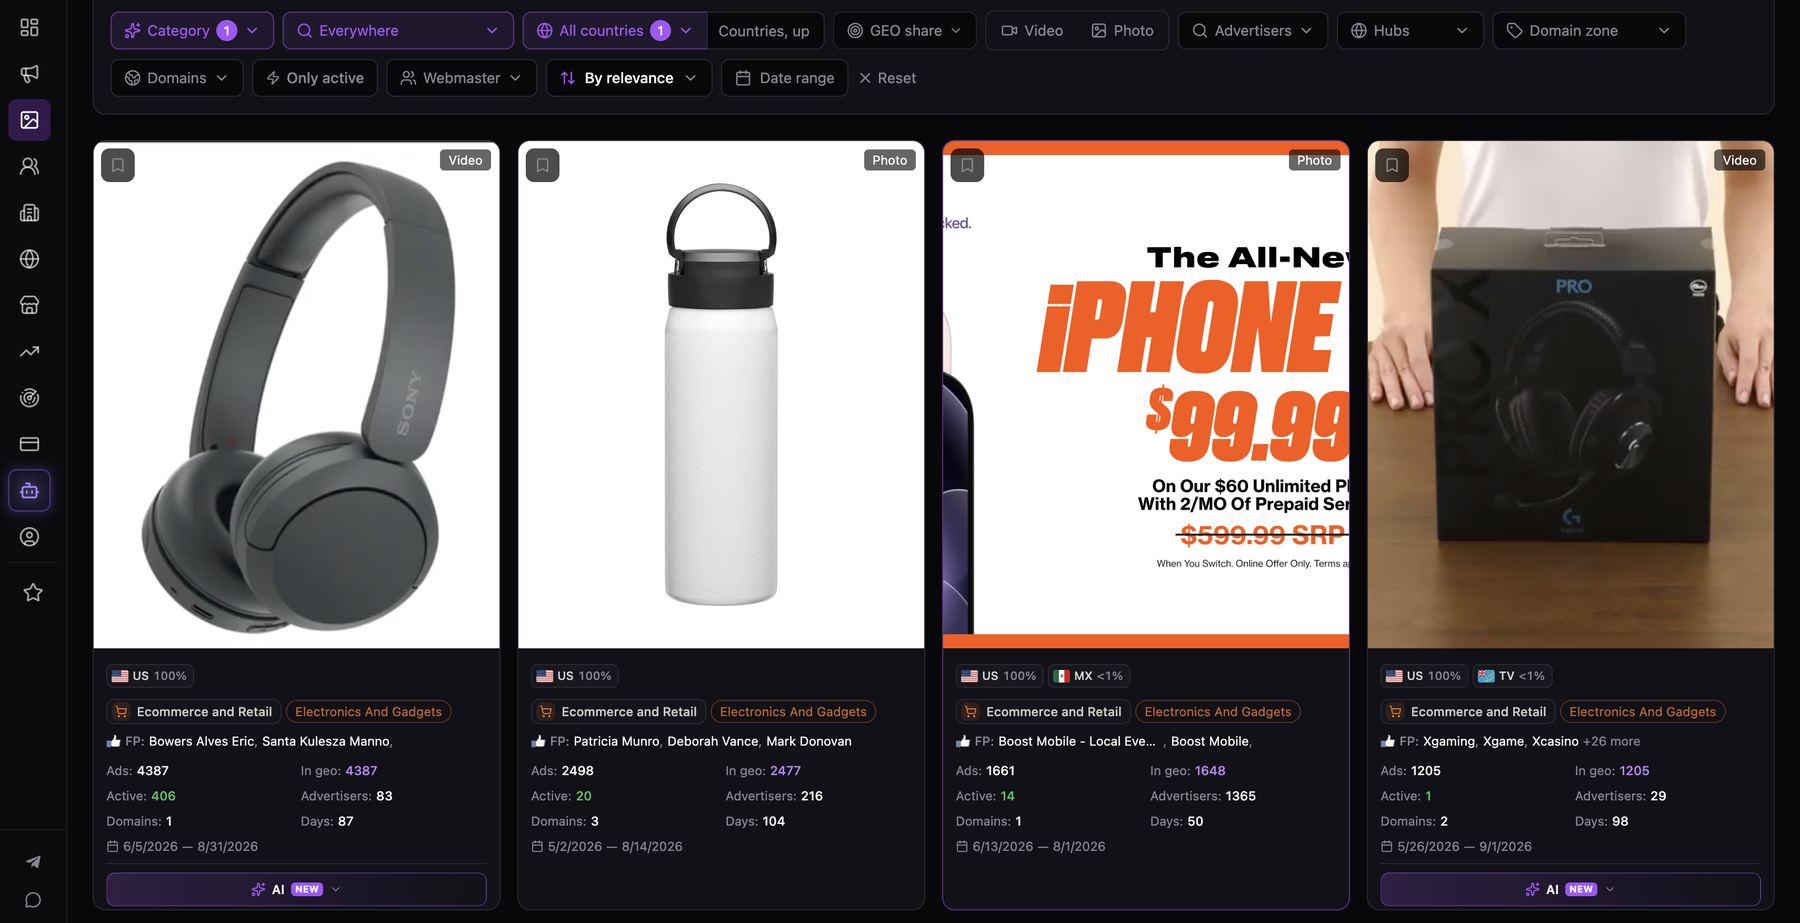
Creatives, filtered to one category, shows it directly. Every card carries four numbers: its ad count, how many advertisers run it, how many ads are still live, and how many days the oldest instance has survived. A wall of product photos becomes four numbers you can compare side by side. I took four cards from one electronics slice:
| Creative | Ads | Advertisers | Still active | Days |
|---|---|---|---|---|
| Wireless headphones | 4,387 | 83 | 406 | 87 |
| Insulated bottle | 2,498 | 216 | 20 | 104 |
| Phone-plan promotion | 1,661 | 1,365 | 14 | 50 |
| Gaming headset | 1,205 | 29 | 1 | 98 |
The headphones are the only live sub-angle here: 406 ads still running after 87 days, across 83 advertisers. The bottle ran longer, 104 days, but it's down to 20 live ads across 216 advertisers. That sub-angle has already been worked out. The gaming headset has one ad left out of 1,205. The phone-plan promotion spreads 1,661 ads across 1,365 advertisers, barely more than one ad each. That's the shape of a brand campaign bought across many pages. It isn't a dropshipping angle at all.
So one category with comparable ad volumes gives four different verdicts. Only the first is a live sub-angle with real seller depth behind it. In practice, a category total would count all four toward one healthy-looking number. A “profitable niches” list would name the category all four sit in.
Seasonality and geography
Some categories are profitable dropshipping niches for eight weeks a year and dead the rest of it. A “profitable niches” list published in January can't warn you about a category that only works in November. Others run the opposite pattern. Demand stays steady, but the country it comes from has shifted, and nobody updated the list.
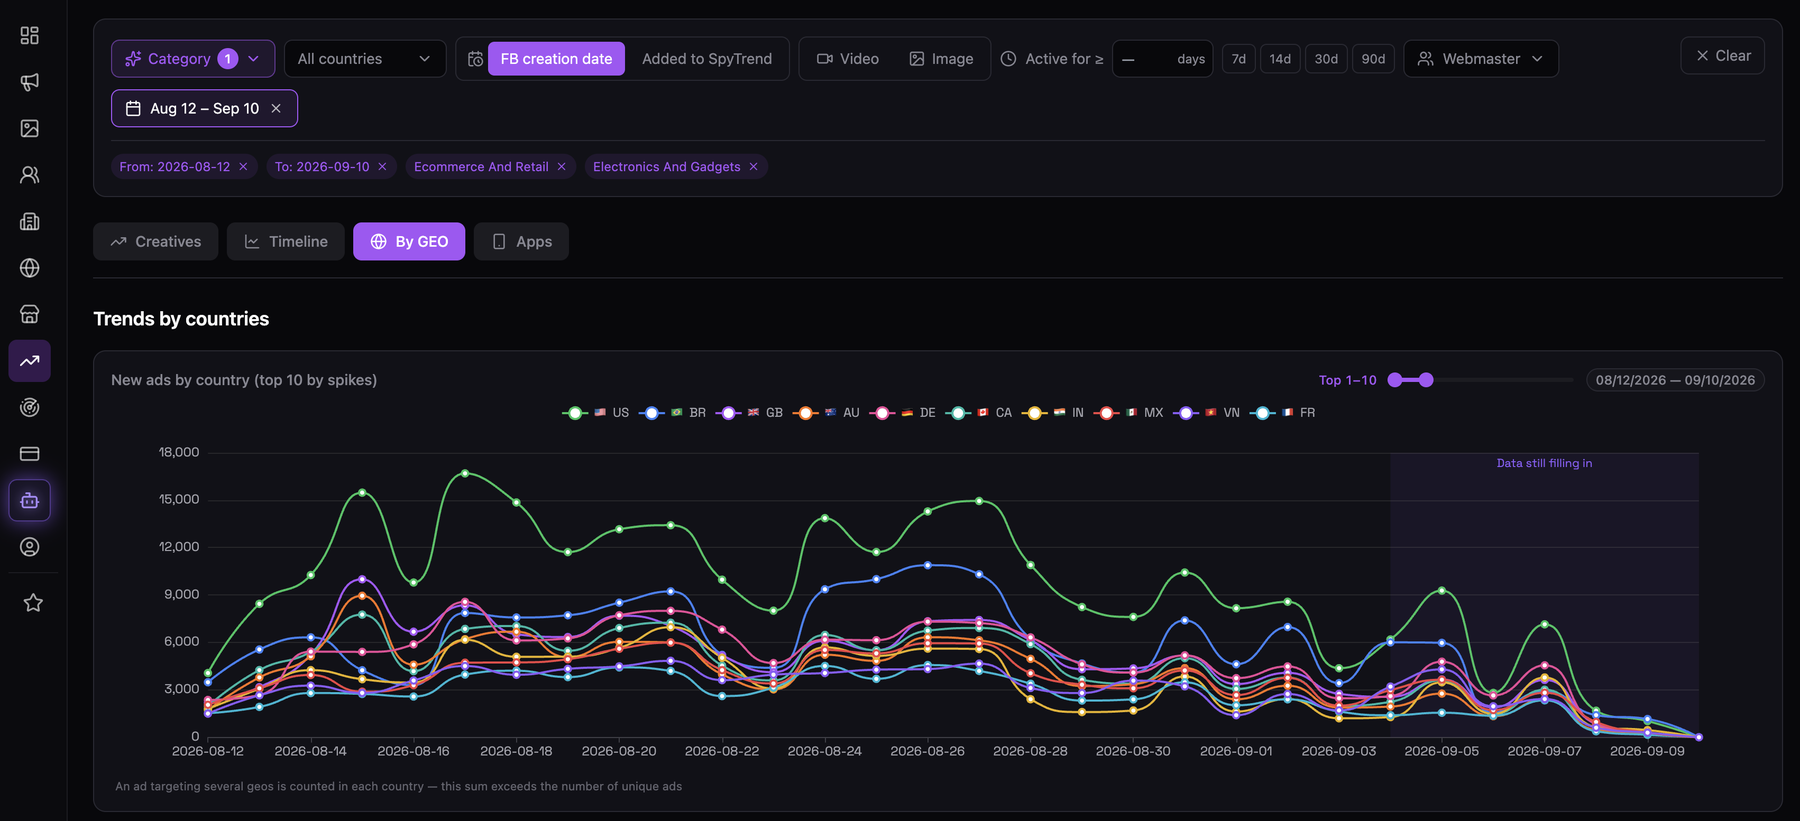
Both signals show up in the same place. Trends → By GEO splits a category into per-country rows. Each row shows active ads, total ads, ads started today, the fan pages running them, and how long the average page in that market survives. For niche research, read several of those rows side by side. A category's global total can hold steady for a whole year while the market underneath it turns over. One country cools off, another picks up the slack, and the total reports neither. Comparing rows is also the only reliable way to tell a year-round category from one that pays for eight weeks and goes flat for the other forty-four.
The same data as a chart puts ten markets on screen at once over a month. The shape is rarely the same in any two of them. I charted new ads for one electronics slice over a 30-day window. The US line stayed above every other market for the whole window, at points about double the next one. For most of the window it swung between about 8,000 and 17,000 new ads a day. It dipped lower at the start and in early September, and the chart marks the last days as data still filling in. Brazil climbed into second place only partway through the window. The other eight markets moved together in a tight band underneath. A single global total would have flattened all of that into one number that describes none of them. In practice, read the row for the country you plan to sell in before you trust the global line.
Filtering by Days Active: the survival signal
This filter turns a vague sense of “lots of ads” into something you can measure. Days Active counts how long an ad has run continuously. I set it to 30 or higher in Ads, filtered to the United States and the Electronics and Gadgets subcategory. What you look at next is the share of the category's ads that survive the filter. The raw count of survivors says much less.
Picture a category with a thousand active ads where almost none clear 30 days. It's full of tests. Lots of people are trying the same thing and mostly failing at it. Now picture a category with a fraction of that ad count, where most of what's running has lasted well past 30 days. That's the opposite signal. Fewer people are trying, and the ones who are keep paying because it works. Ad count alone can't tell those two categories apart. The survival rate behind the count can. It's what separates a crowded niche from a profitable dropshipping niche that simply doesn't attract volume yet.
Anatomy of the niche: how many operators, not how many stores
A category page showing fifty active stores looks like fifty confirmations that the niche works. It usually isn't fifty. Some of those storefronts belong to the same few people running the same bet across several domains. A plain store count has no way to separate them.
In Spytrend's Websites view, sort a category's stores by visits. You can also switch to the Fast growing preset to see which stores are climbing on paid traffic right now, as opposed to search rankings built over years. Then open the fastest-growing stores in Webmasters one at a time. The Webmasters section assembles the domains, pixels and countries of a single operator into one card, built in advance. Do this for a handful of the category's top stores and a pattern shows up quickly. Some of those fifty storefronts collapse into far fewer real operators.
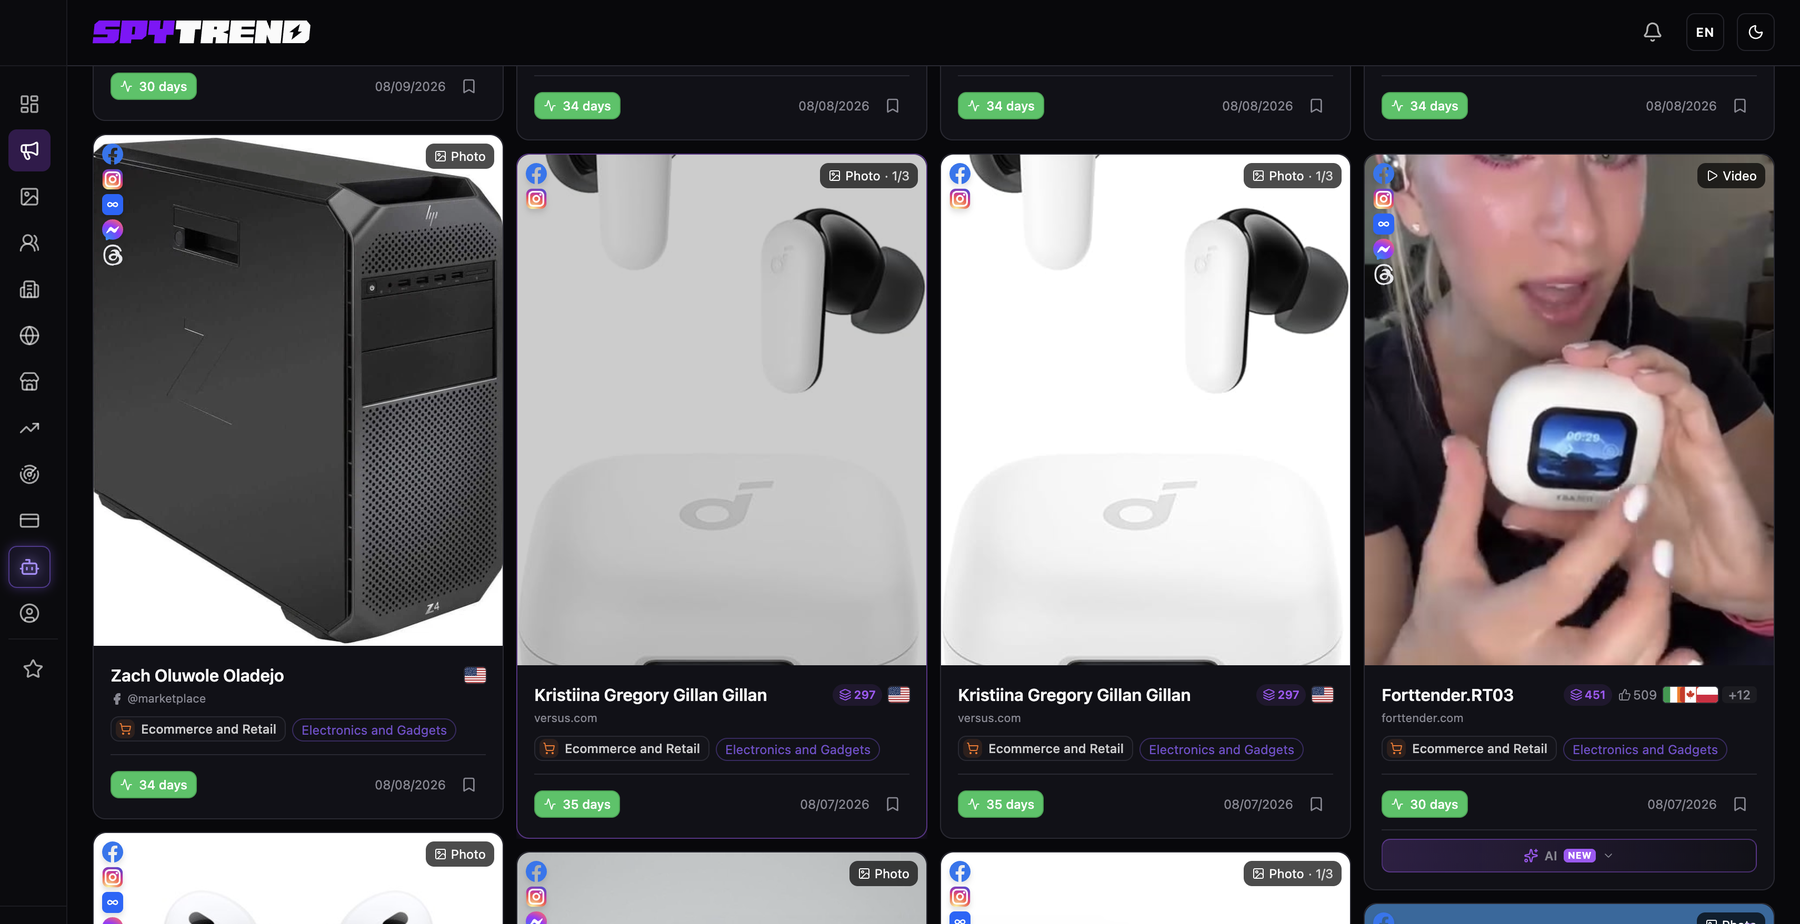
The same collapse happens one level below the storefront, where it's easier to miss. I narrowed Creatives to one store's ad feed. It carried a set of unrelated angles: driveway cleaning, phone cases, kitchen gadgets, skincare. Each ran under its own advertiser page name, in its own country. Four page names on one domain look like four sellers who each validated the category. In fact it's one operator spraying a catalog across four markets to see which one answers. On a niche-level count, each of those page names would register as separate evidence.
I followed that feed through to its operator. The Webmaster card shows 6 domains and 2 Facebook pixels, with 1,355,150 ads total, 33,996 currently active and 1,321,154 stopped. On a plain store count, each of those six domains would register as a separate confirmation that the category is worth entering. Grouped, they're one bet tested six ways over, and mostly abandoned: 97% of everything this operator ever launched is stopped. That's the correction a niche-level count needs. A “profitable niches for dropshipping” list has no way to catch it, because it never looks past the storefront to who is behind it.

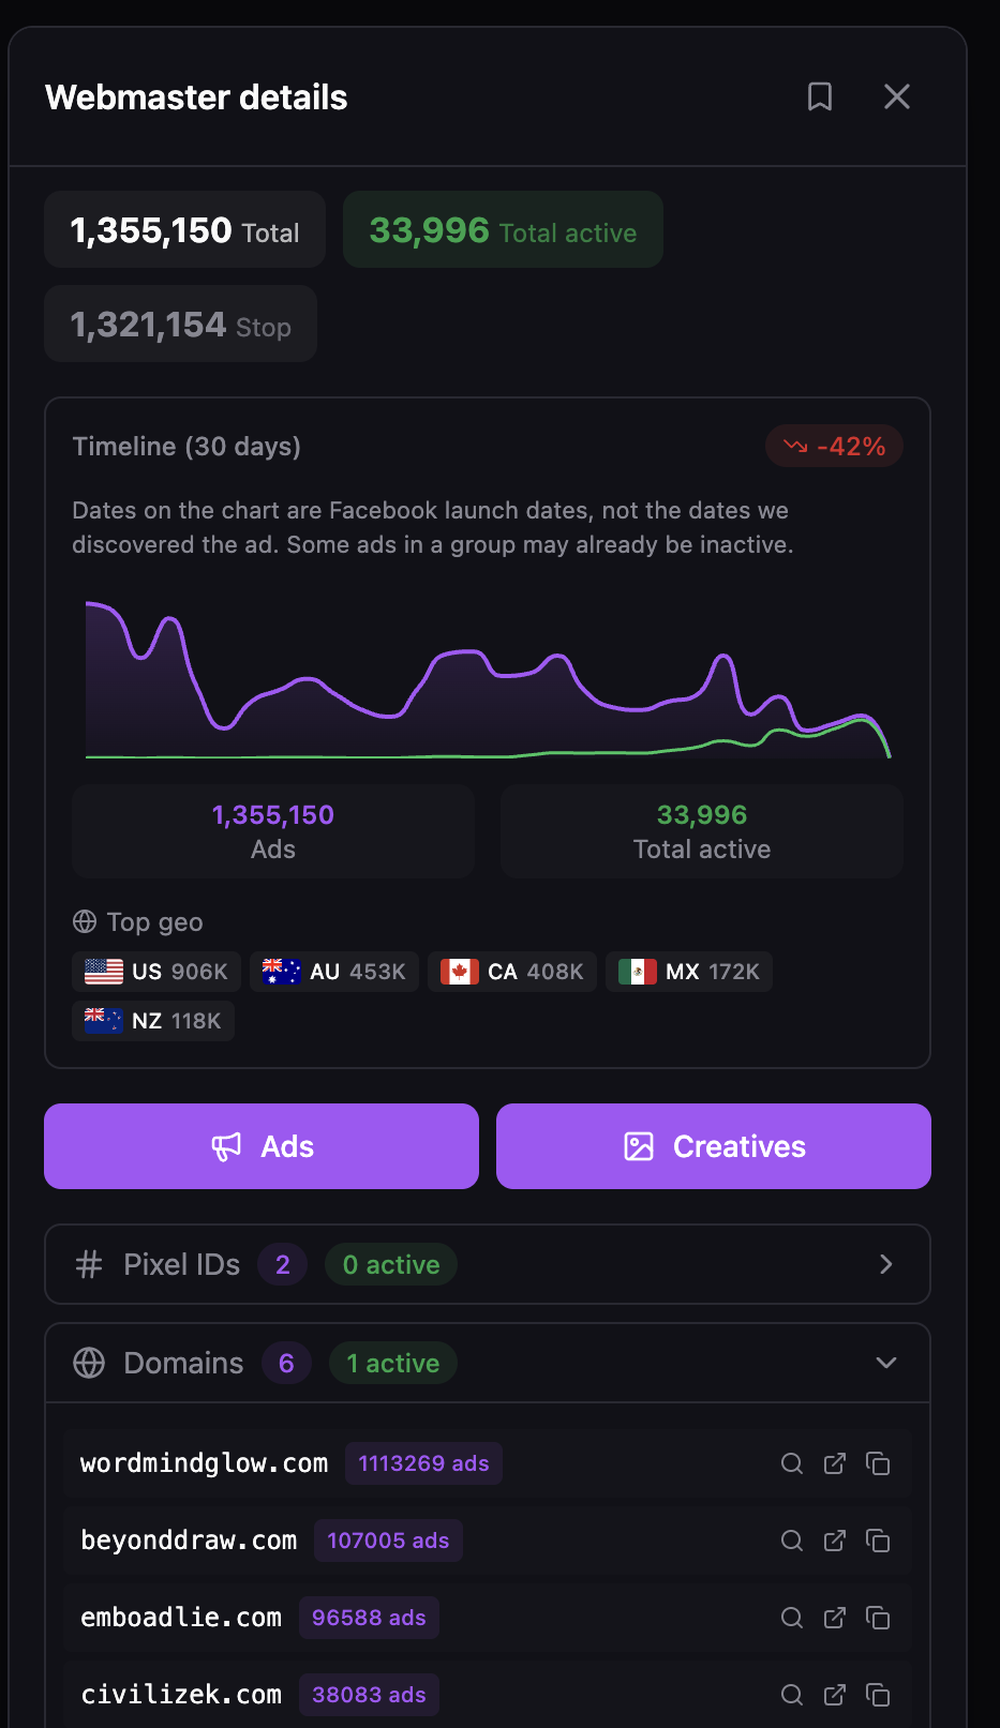
Repeat the check across enough of a category's top stores, and a rough operator count emerges. It's a far more honest measure of how crowded a niche is than the storefront count a category page shows by default.
When this workflow is worth doing systematically
Checking one candidate niche by hand fits in a single sitting: a pass through Trends, a Days Active filter, a few Webmaster look-ups. It needs nothing beyond a free Starter account. That's enough to decide between two or three niches already on a shortlist.
It stops being enough when the question is which part of a whole category tree is worth entering this quarter. Next quarter the answer may have changed, and you'll need to check again. Rebuilding that by hand every few months, across enough categories to matter, makes the free-tier workflow the most expensive part of sourcing.
The free Starter tier in Spytrend runs on ads from three months back. That's too old to show what's hot this week. It's current enough to walk the whole workflow once and see whether it fits how your catalog gets sourced. Whether the full grid described on the pricing page earns its place depends mostly on how often you need to re-check the category tree.
Signals that separate a profitable niche from a crowded one
- Ad volume that has held for weeks. A single burst of new ads is a test wave. Check whether the volume is still there a few weeks later.
- A meaningful share surviving Days Active 30+. Raw ad count mixes tests and winners. The survival rate behind the count separates them.
- More than one independent operator. The Webmasters section turns a category's store count into its real operator count. That number is often much smaller.
- A sub-angle carrying the category. A category can look flat while one narrow angle inside it quietly does all the work. Or all the decline.
- A geography and season that still match today. In aggregate, a category can look the same year over year. Meanwhile the market and the month that actually fund it may have shifted completely.
Try it on your own shortlist. Take one niche from a 2026 roundup and open Trends for the country you sell in. Then set Days Active to 30 in Ads and open the Webmaster card behind a few of the top stores. Compare what you find with what the list promised.
FAQ
Profitable dropshipping niche: what actually makes one?
A profitable dropshipping niche needs three things: sustained ad volume, a meaningful share of ads surviving 30+ days, and more than one independent operator funding it. A spot on a trending-niches list isn't one of them. Margin and supplier price still decide whether the niche pays you. Ad data shows whether it already pays anyone else.
Profitable dropshipping niches: can you trust the 2026 roundup lists?
Profitable dropshipping niches from 2026 roundups are a starting point. The same categories repeat on these lists year after year, because the lists get copied forward faster than the market inside each category changes. Checking current ad volume and Days Active for a candidate from one of these lists takes minutes. It tells you whether the list is still right.
How many competitors is too many for a dropshipping niche?
Store count won't answer this. A niche with fifty visible storefronts can turn out to be a dozen real operators. That happens once the Webmasters section groups the stores one person runs across several domains. Check the operator count before you decide a niche is too crowded. The storefront count overstates it.
Profitable niches for dropshipping: why research the category before the product?
Profitable niches for dropshipping are judged a level above the product. Product research asks whether one specific item is still selling. Niche research asks whether the whole category is worth entering. It looks at sustained volume, survival rate and operator count for the category, before you narrow down to one product. Both run on the same class of tool; the ad spy tools overview covers it.
Does a niche that worked six months ago still work today?
Sometimes, and the only way to know is to check it again. Ad volume and Days Active drift over months, even when a category's label and reputation stay the same. A niche that was profitable at the start of the year isn't guaranteed the same funding by the end of it.
Do I need to check every sub-category by hand?
Not if the goal is one or two niches. For a shortlist, the Trends and Ads workflow above is quick enough to run by hand. It starts to matter once the check has to repeat across a full category tree, on a schedule. At that point a systematic process pays off more than a fresh manual pass each time.