Short answer: Spytrend is a spy tool for studying Web2App funnels, from ads and quiz questions to subscription choices on the paywall. Before launching a test, marketers, media buyers and subscription app teams can compare brand activity, review competitors’ screens and choose hypotheses to test.
UI data as of October 23, 2026.
Key takeaways
- 1.3M new ads in September — monthly Web2App advertising activity in Spytrend’s database. → Read more
- BetterMe leads with 493.3K ads for July–September, while trends in ad launches and visuals differ. → Read more
- The library of 2,027 funnels includes growing examples: Dressly shows +271% growth over 30 days. → Read more
- Deepstash can be explored through 53 screens, subscription plans and current ads. → Read more
- Two saved Deepstash versions contain 38 and 53 screens, with prices in euros and dollars. → Read more
- Access starts at $599/month, and 10 funnels of the week are available without a subscription. → Read more
01 · Advertising activity
1.3M new ads in September show the scale of activity
Market overview shows the monthly volume of ads leading to Web2App quizzes. In September, Spytrend’s database recorded 1.3M new Meta ads — 6% fewer than in August.
The overall trend gives context to changes in an individual brand’s activity. Ads and visuals can move in different directions: September brought fewer new ads, but the number of visuals rose by 5% to 391.2K.
July was the peak of the period shown, with 1.8M new ads. October has recorded 564.7K so far, but the month is still in progress: it is too early to compare its total with a completed September.
Before June, most of the growth on the chart came from expanding database coverage. Coverage has been 98% or higher since July, making July–September a useful period for comparing completed months. These figures come from Spytrend’s database: ad launch counts indicate advertising activity, not spending or sales.
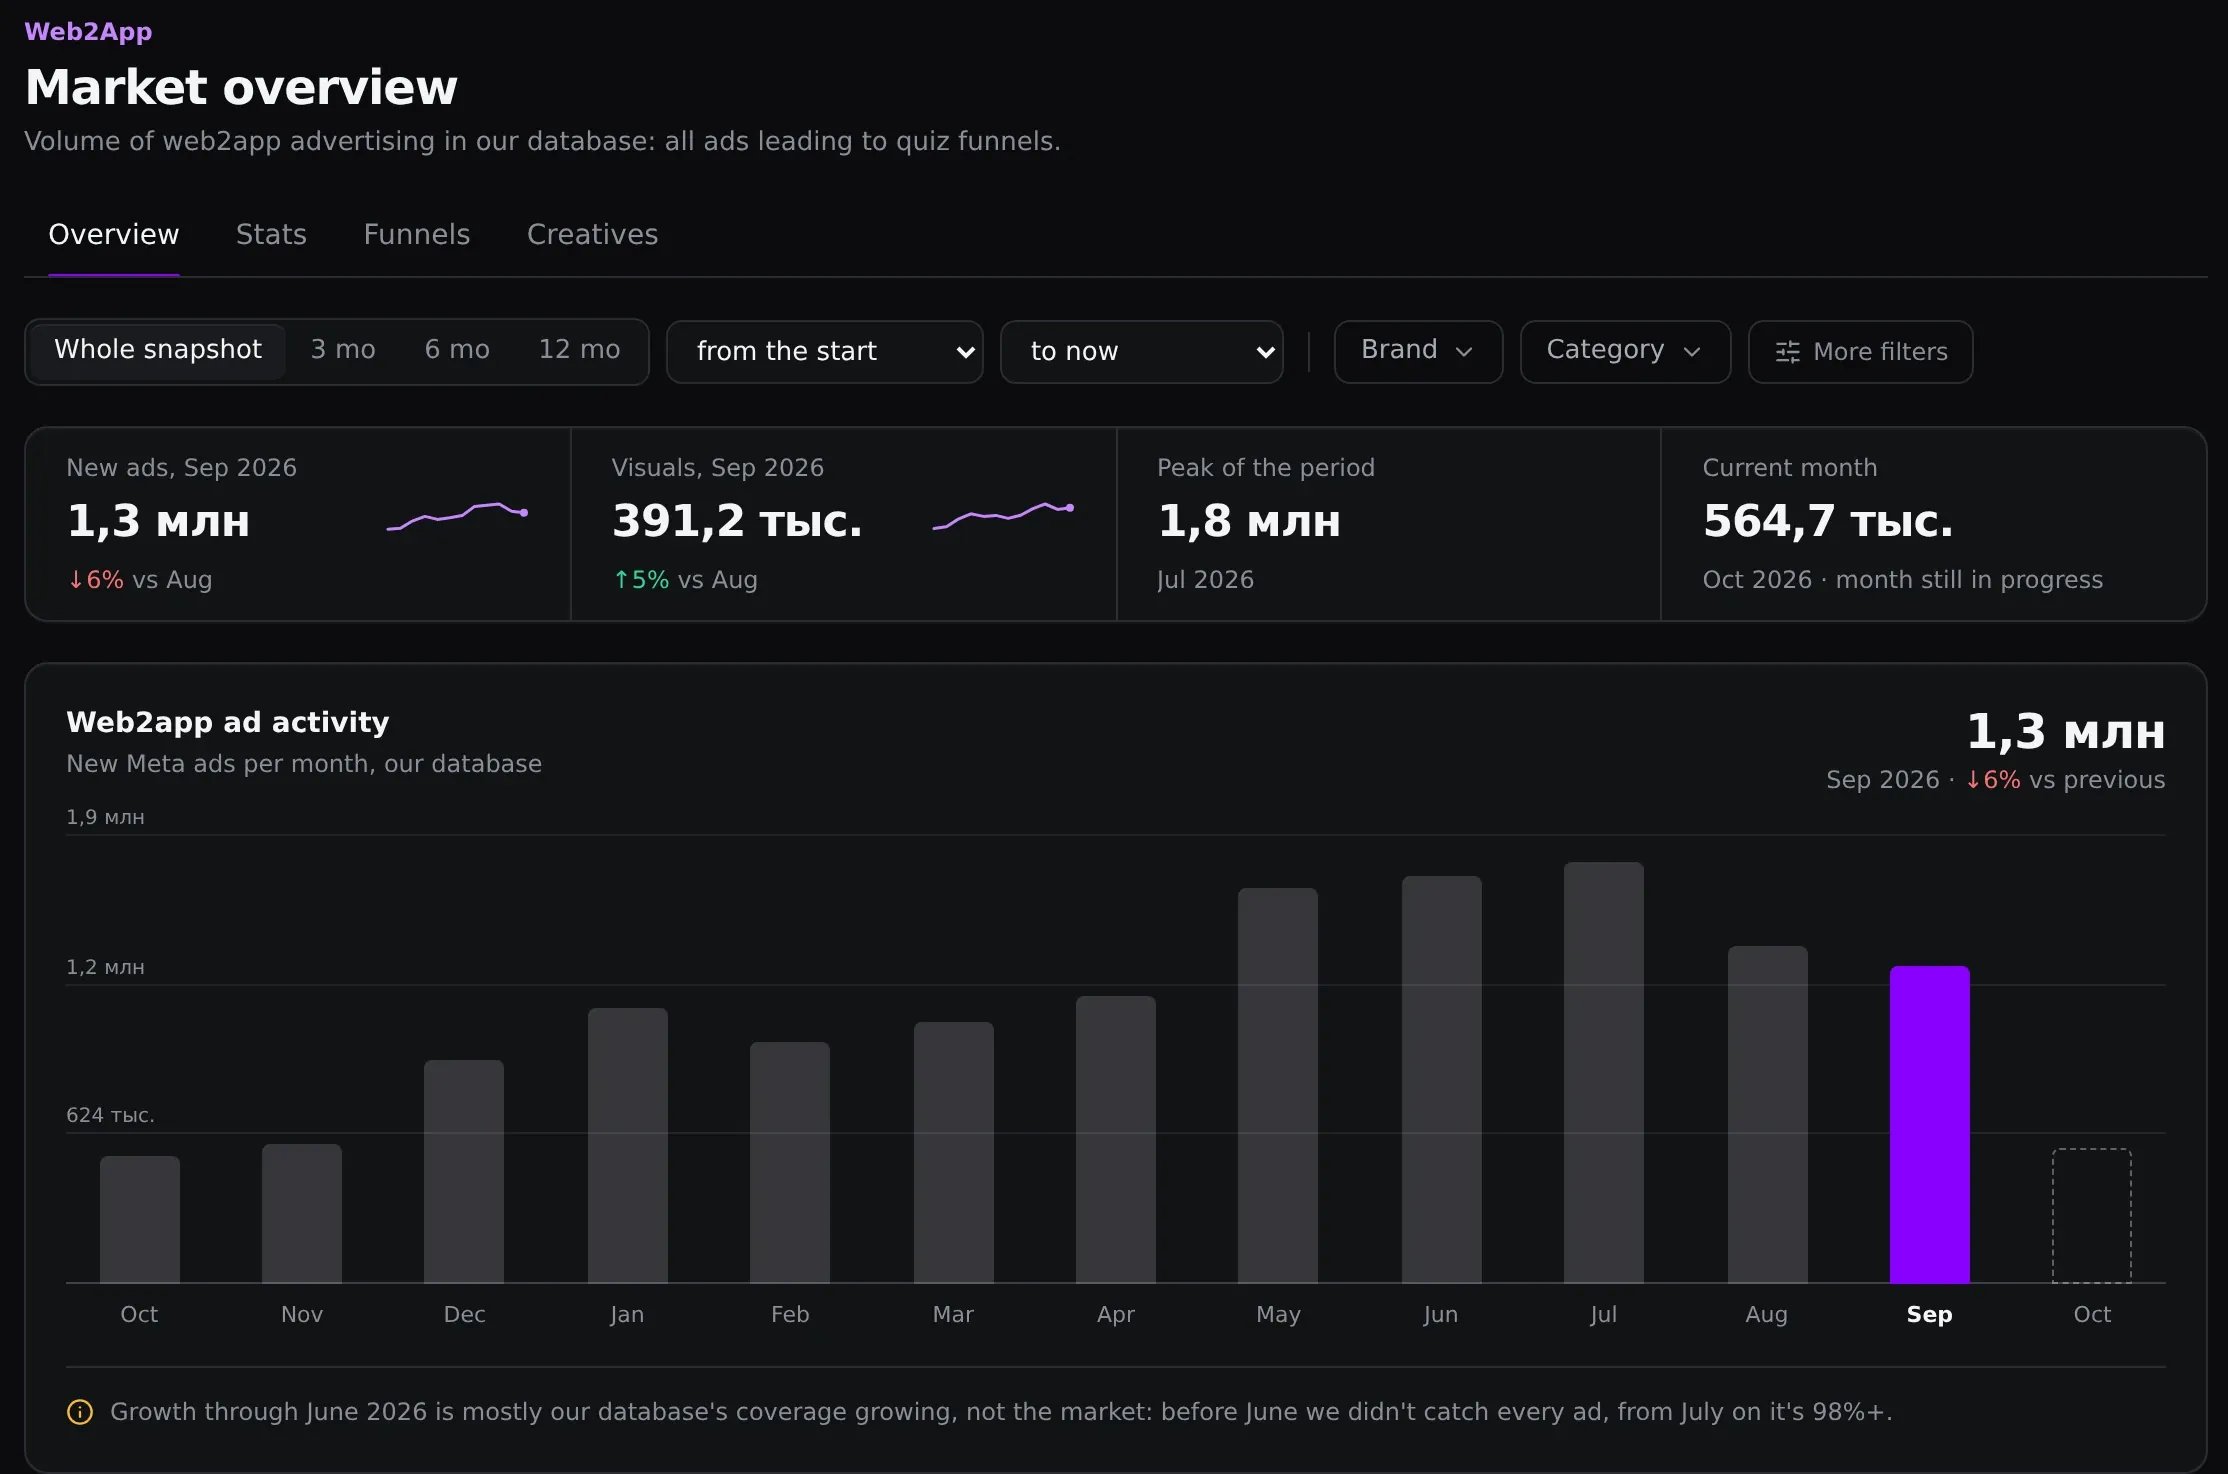
Period, brand and category filters help narrow the overview to a relevant segment. For a closer look at finding ads, see the article on Meta Ads Library search.
02 · Brands and visuals
BetterMe leads with 493.3K ads over 3 months
BetterMe ranks first by ad count for July–September. In September, MuscleBooster and Dressly increased their new ad counts compared with August, while the database recorded 0 new ads for Liven.
Monthly trends add context to total volume. A large advertiser may maintain a steady pace of launches, while a brand with a smaller total may grow sharply.
The table shows 4 brands from the top ten by ad count for July–September.
| Brand | Ads in July–September | New ads in September | September vs. August |
|---|---|---|---|
| BetterMe | 493.3K | 169.4K | +1% |
| MuscleBooster | 145.3K | 50K | +104% |
| Dressly | 115.4K | 31.2K | +156% |
| Liven | 137.4K | 0 | −100% |
MuscleBooster had 70.7K new ads in July, 24.5K in August and 50K in September. Dressly recorded 72K, 12.2K and 31.2K, respectively. The increases of 104% and 156% compare September with August.
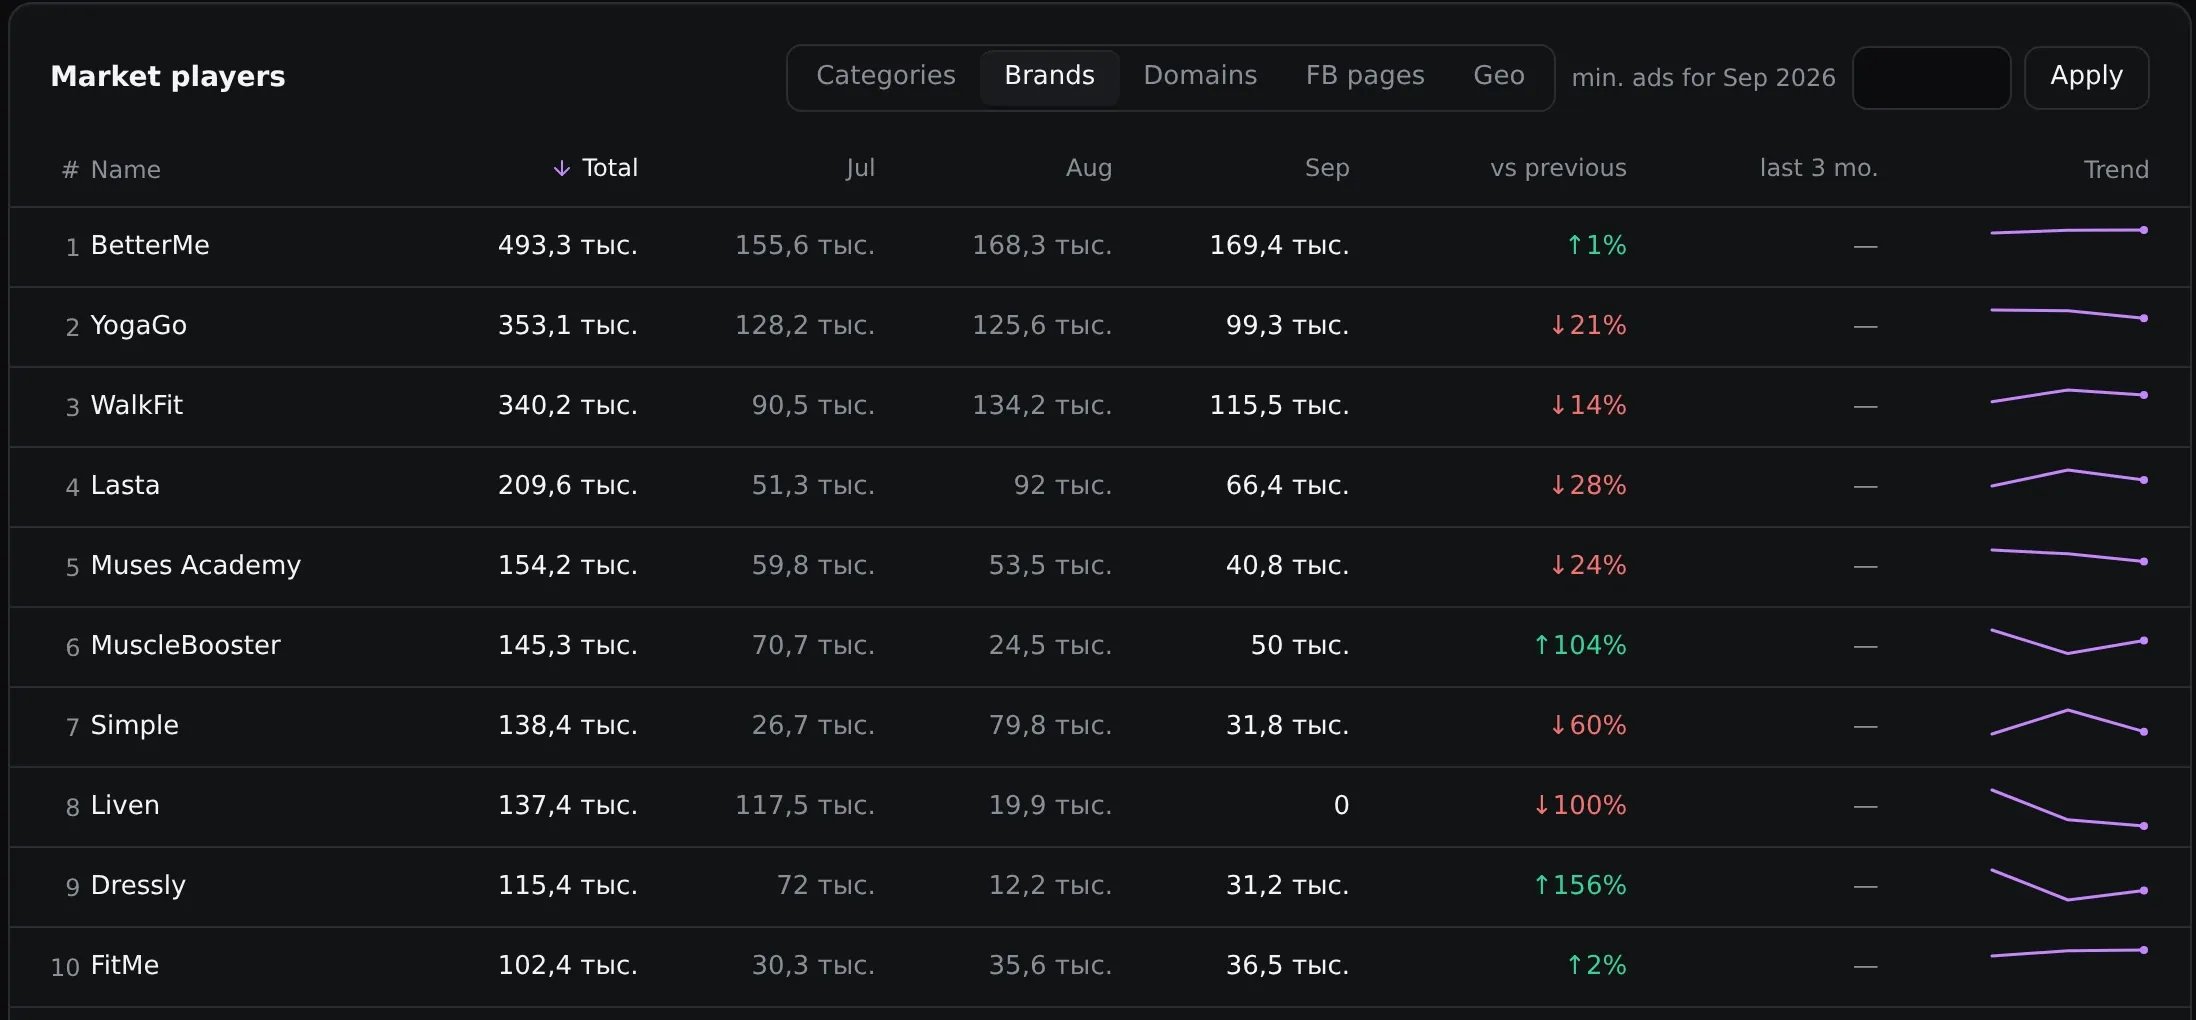
To assess advertising variety, look at visuals separately. A brand’s position in the ad ranking does not necessarily match its position by visual count.
| Brand | Ads in July–September | Visuals in July–Sept. |
|---|---|---|
| BetterMe | 493.3K | 111K |
| WalkFit | 340.2K | 29K |
| FitMe | 102.4K | 60.7K |
WalkFit ranks third by ad count but has fewer visuals than FitMe. Check both metrics when reviewing a high volume of launches: one counts ads, while the other counts visuals.
Their trends also differ. BetterMe’s new ad count rose by 1% in September, while its visual count fell by 7%. Dressly grew by 156% in ads and 194% in visuals.
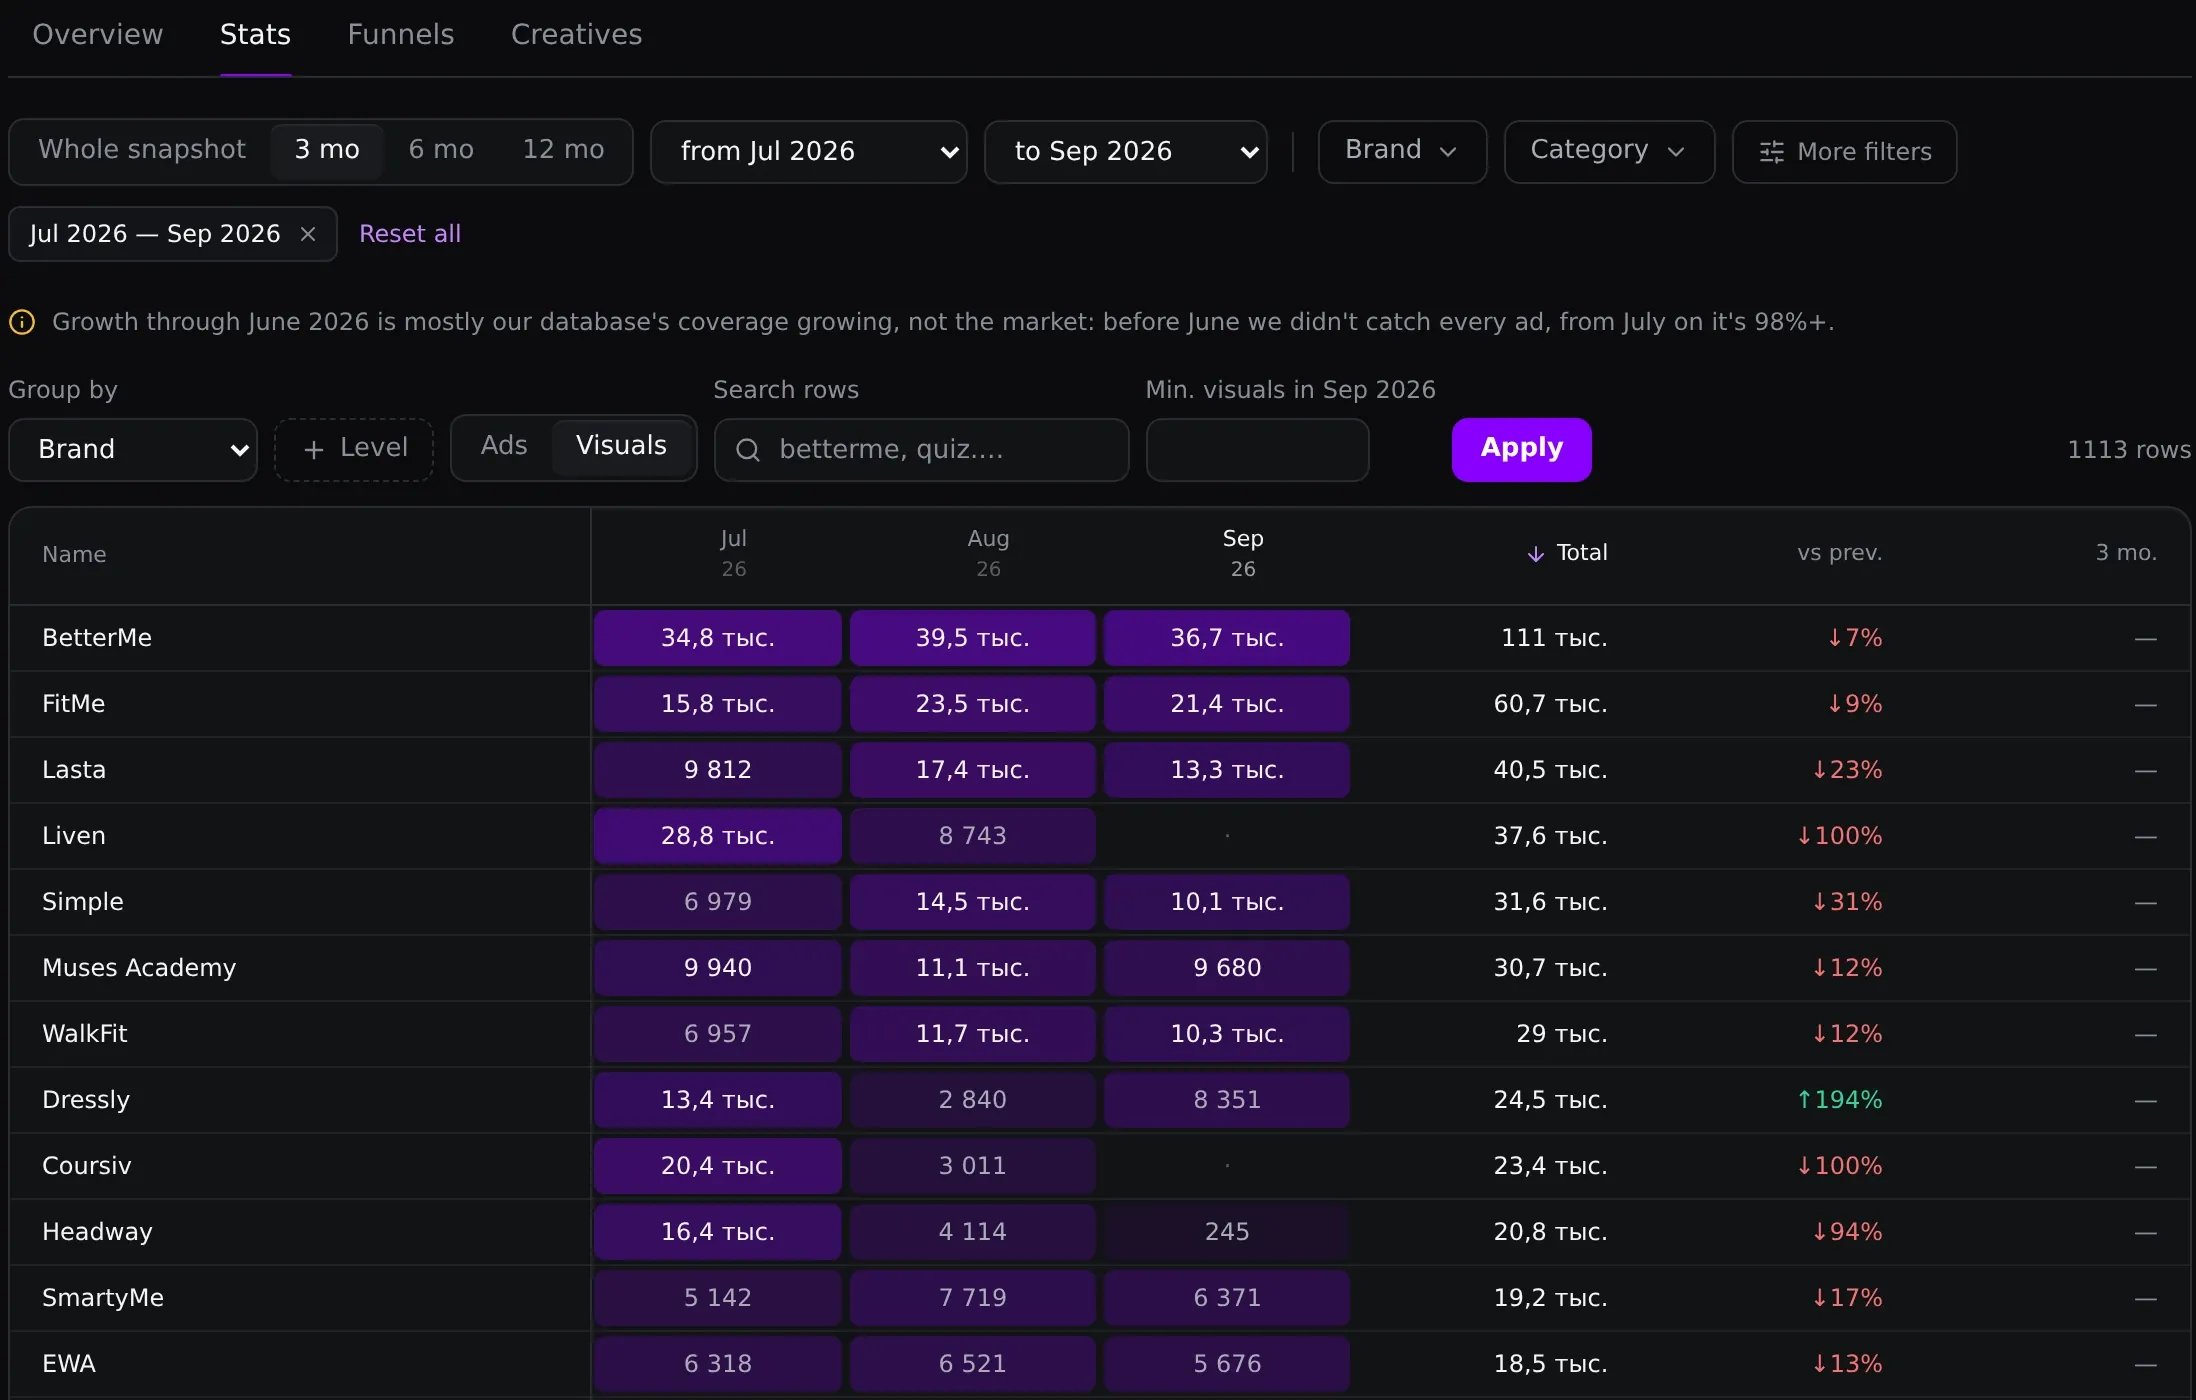
This comparison helps media buyers decide what to investigate next: the scale of ad launches or the range of visuals. For other tasks in this role, see the article on the work of a media buyer.
03 · Finding funnels
The library has 2,027 funnels, with pricing visible in 1,424
Funnel library connects advertising activity with quiz content. You can find funnels by niche and Geo, then examine the questions, selected answers and paywall offer.
1,424 funnels — 70% of the library — have been saved through to a paywall with pricing. Another 350, or 17%, reached an email, registration or payment screen. The listed Outcome tells you which part of the journey is available to review.
The “Growing fastest” sort highlights candidates for further study. Dressly, for example, shows 1,860 active ads and 271% growth over 30 days. Its card includes 52 screens, 7 versions and a price starting at $15.19.
Ad growth is a reason to examine the offer behind the ads and choose a funnel to review.
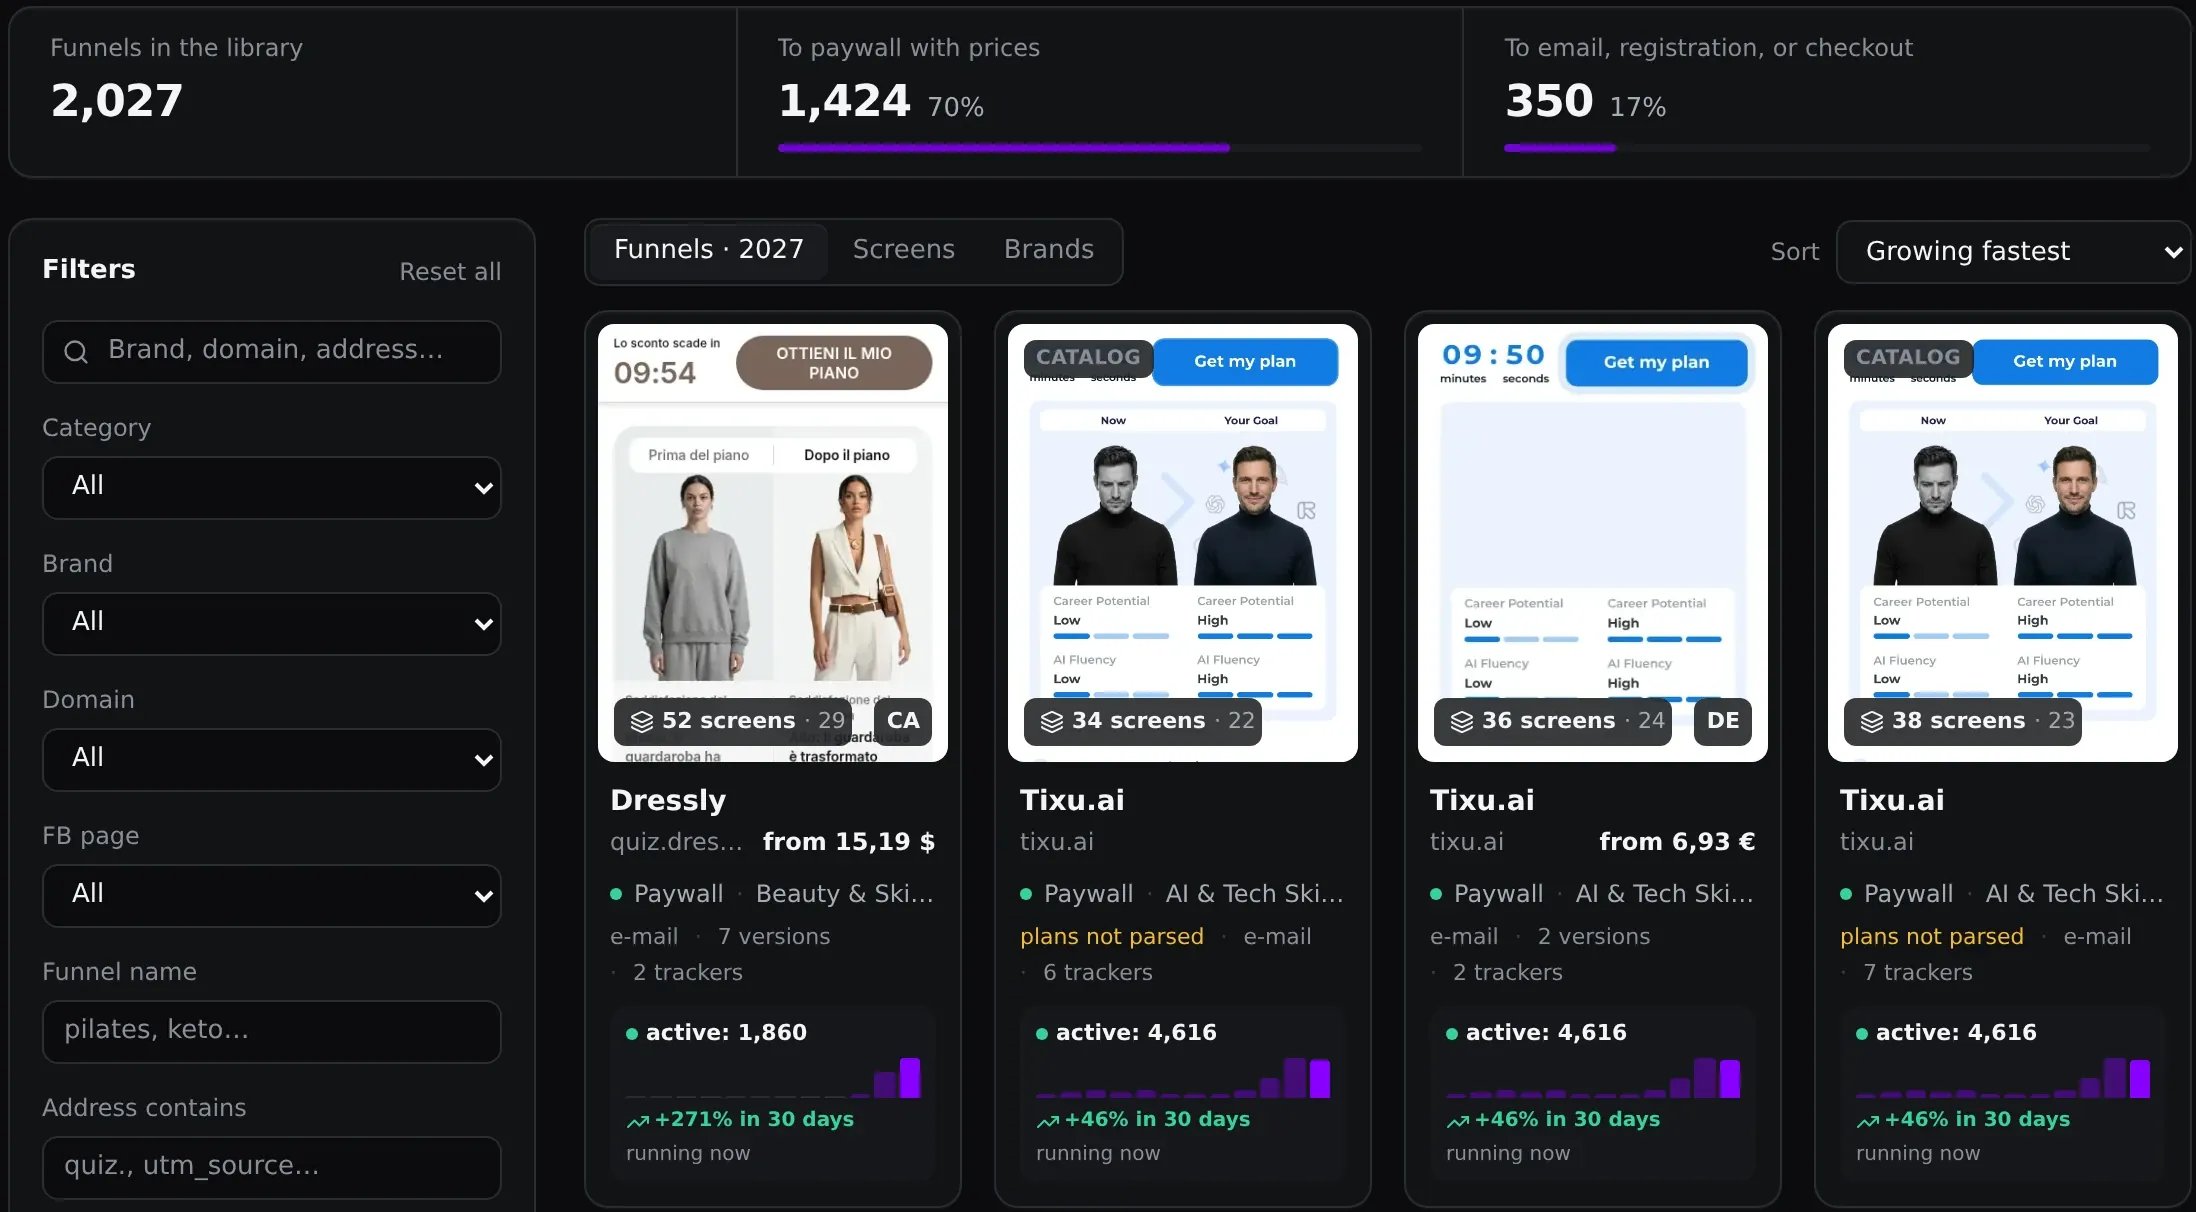
Filters for category, brand, Niche, Geo and Outcome narrow the selection to comparable examples. Instead of browsing every funnel, you can focus on those relevant to your task.
04 · Reviewing Deepstash
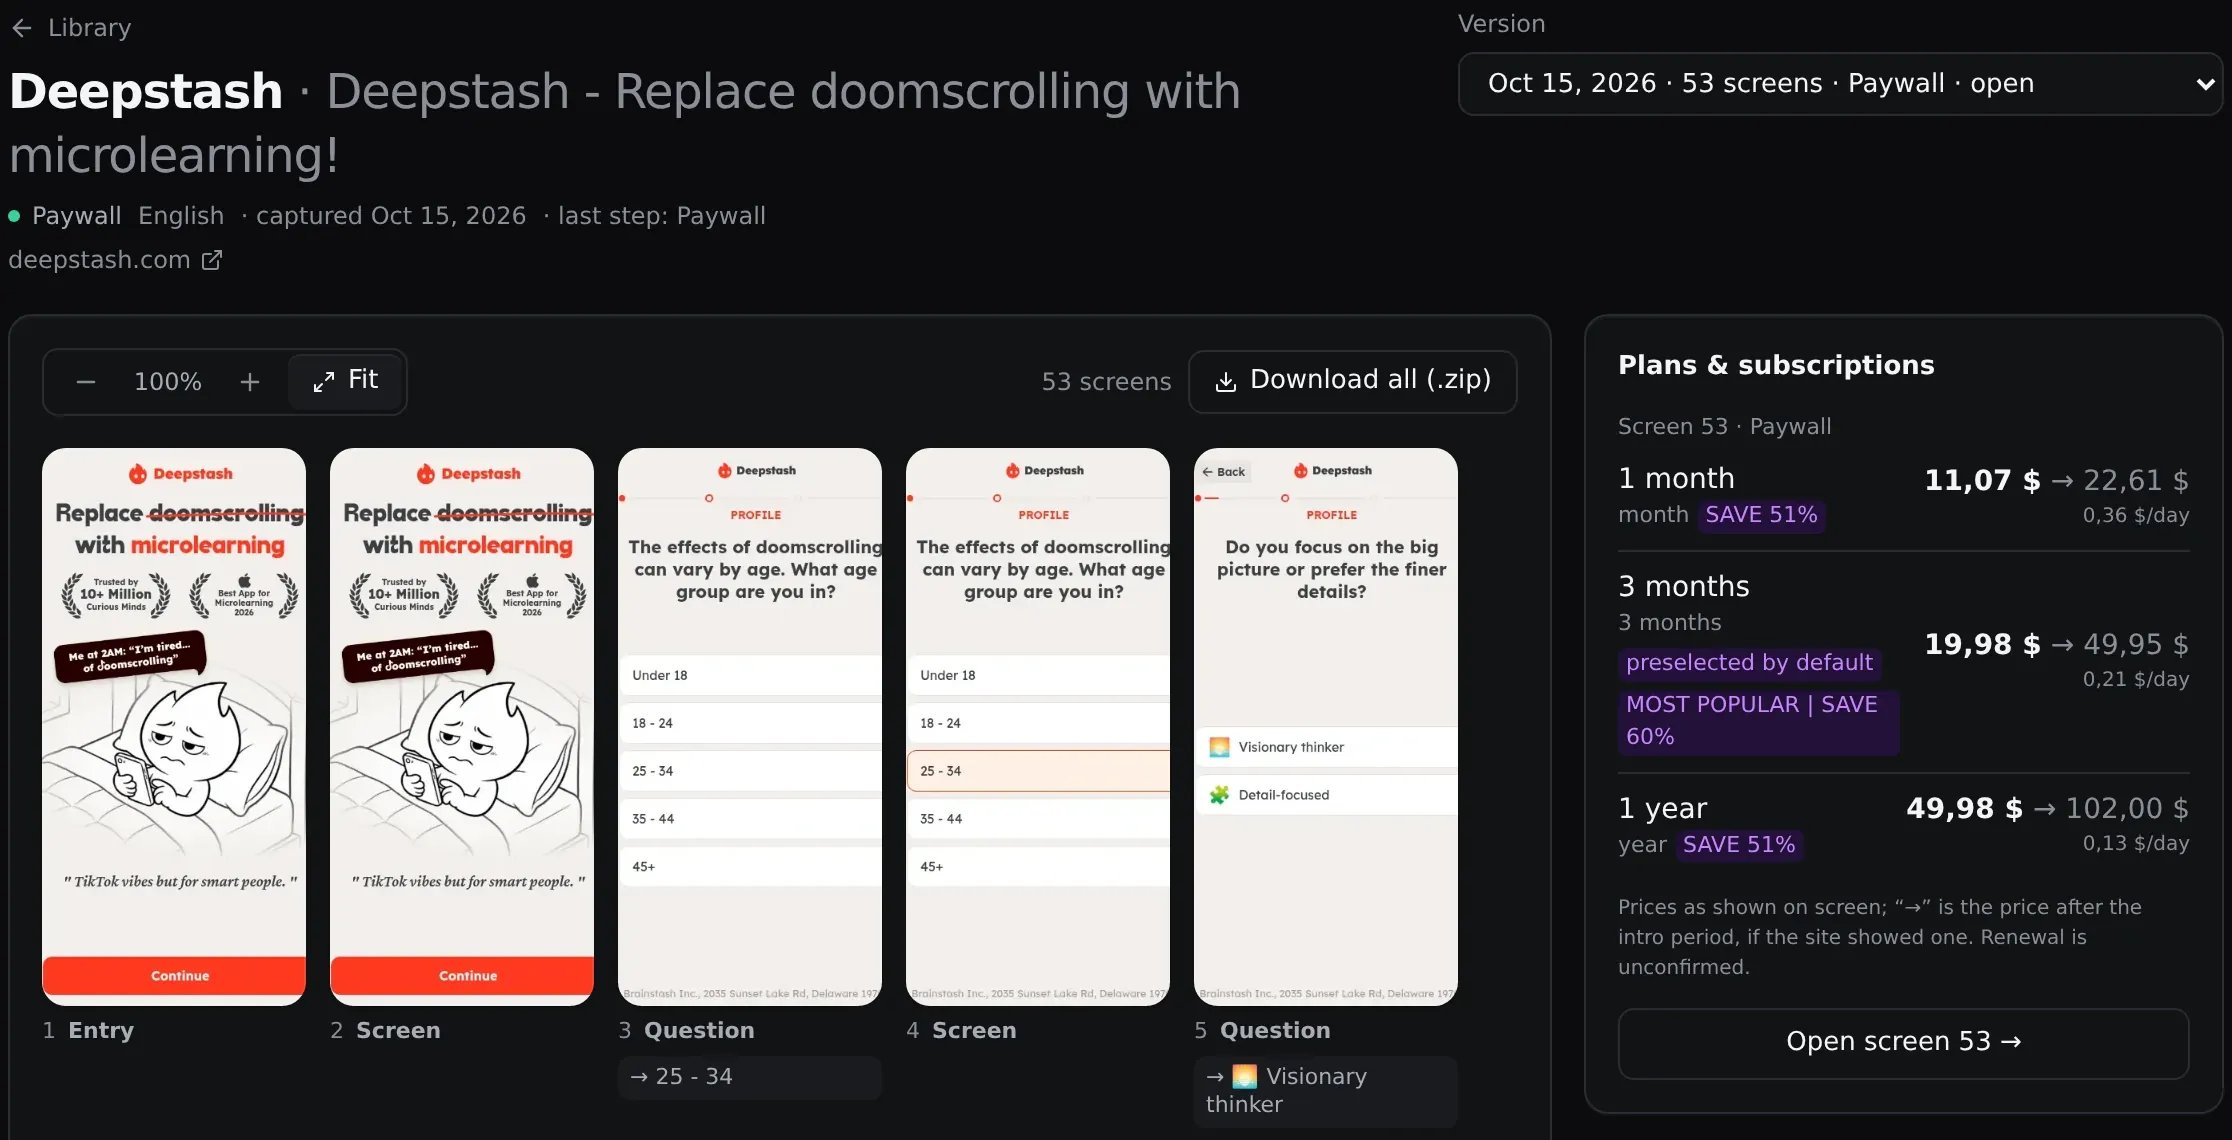
Deepstash’s 53 screens show the path to the paywall
Deepstash provides an example of the quiz sequence leading to a subscription choice. Subscription plans, advertising activity and funnel details are available alongside the screens.
The October 15 version contains 53 saved screens. Each has a type, and questions include the selected answer, such as the age range “25 - 34” and the option “Visionary thinker”. This lets you follow the quiz as a connected sequence and see where questions, facts and the subscription offer appear.
All screens can be downloaded in a ZIP file. The collection is useful for reviewing wording and step order with your team.
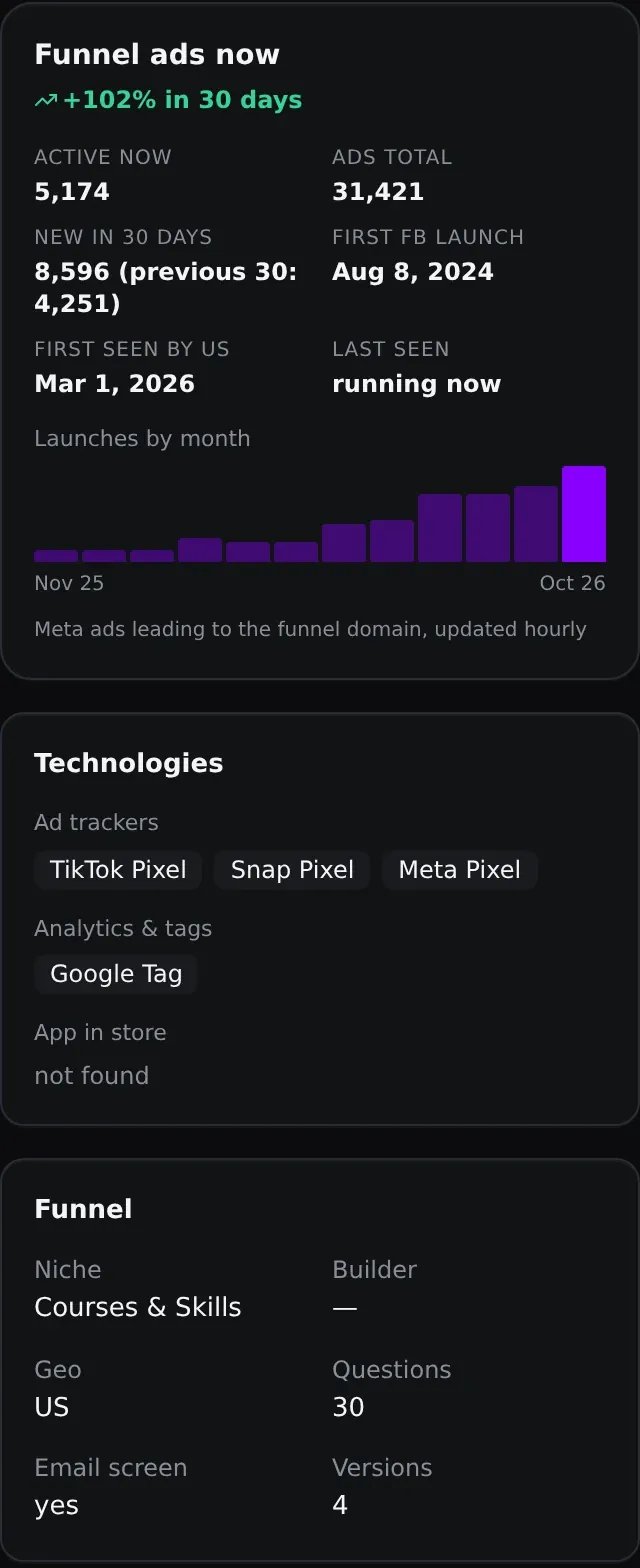
Advertising activity shows how actively the funnel’s domain is being used. Deepstash has 5,174 active ads and 31,421 ads in total. Over the last 30 days, 8,596 new ads appeared, compared with 4,251 in the previous 30 days — an increase of 102%.
This block covers Meta ads pointing to the funnel’s domain and updates hourly. The figures describe domain activity, not the performance of an individual saved version.
The card lists the Niche as “Courses & Skills”, the Geo as US, 30 questions and an email screen. Ad trackers include TikTok Pixel, Snap Pixel and Meta Pixel; the analytics and tags block lists Google Tag.
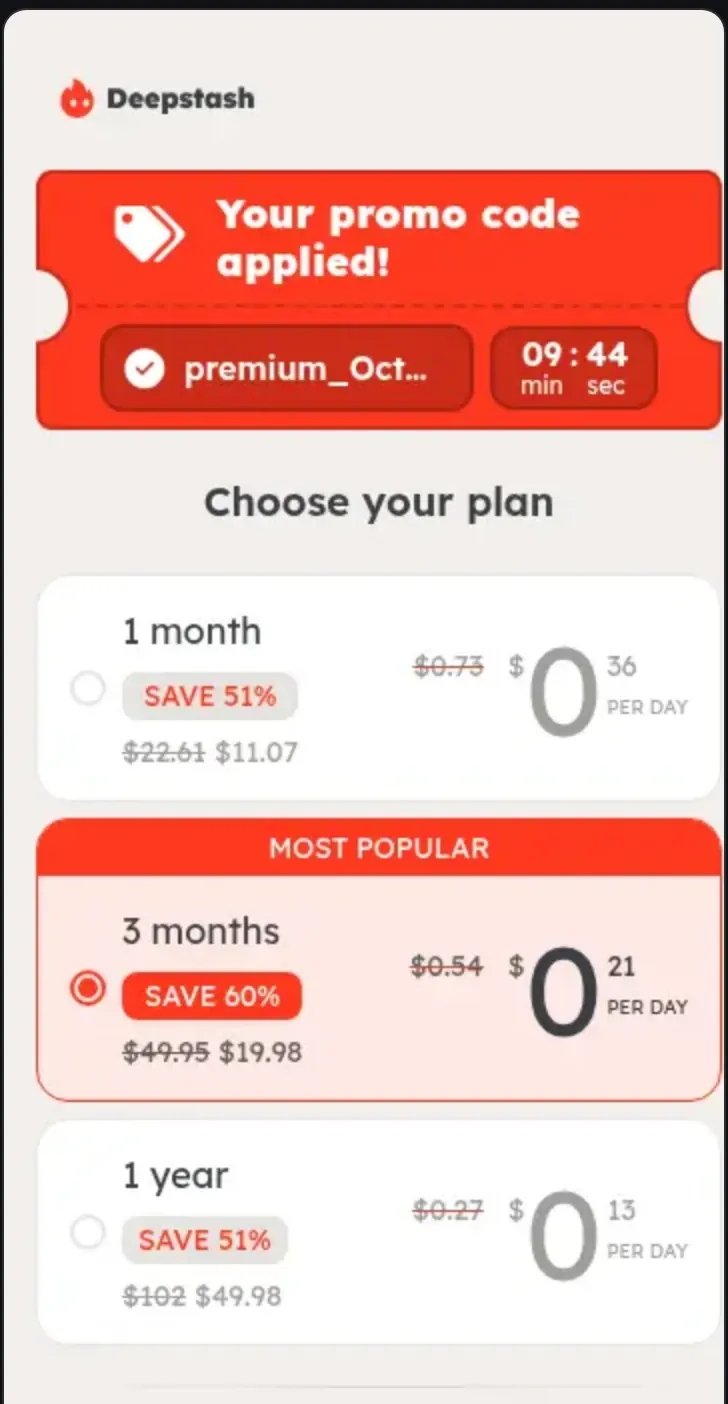
An enlarged paywall view shows which plan the competitor promotes by default and how its price is presented. The screen includes an applied promo code, a “09:44” timer and plans for 1 month, 3 months and 1 year. The 3-month plan is preselected by default and marked “MOST POPULAR” and “SAVE 60%”. It costs $19.98, or $0.21/day.
| Plan | Discounted price shown | Crossed-out price | Price per day |
|---|---|---|---|
| 1 month | $11.07 | $22.61 | $0.36 |
| 3 months | $19.98 | $49.95 | $0.21 |
| 1 year | $49.98 | $102.00 | $0.13 |
05 · Funnel versions
Two Deepstash versions contain 38 and 53 screens
Saved versions let you compare screens and subscription offers. The September 1 snapshot contains 38 screens and prices in euros; the October 15 version has 53 screens and prices in dollars.
The September version shows the same amounts in euros: €11.07, €19.98 and €49.98. The October card displays the plans, the default selection and the daily cost.
The September snapshot lists AppLovin, Google Ads, Meta Pixel, Snap Pixel and TikTok Pixel; its analytics block includes Amplitude and sentry, and Stripe appears among payment solutions. The October card shows TikTok Pixel, Snap Pixel, Meta Pixel and Google Tag.
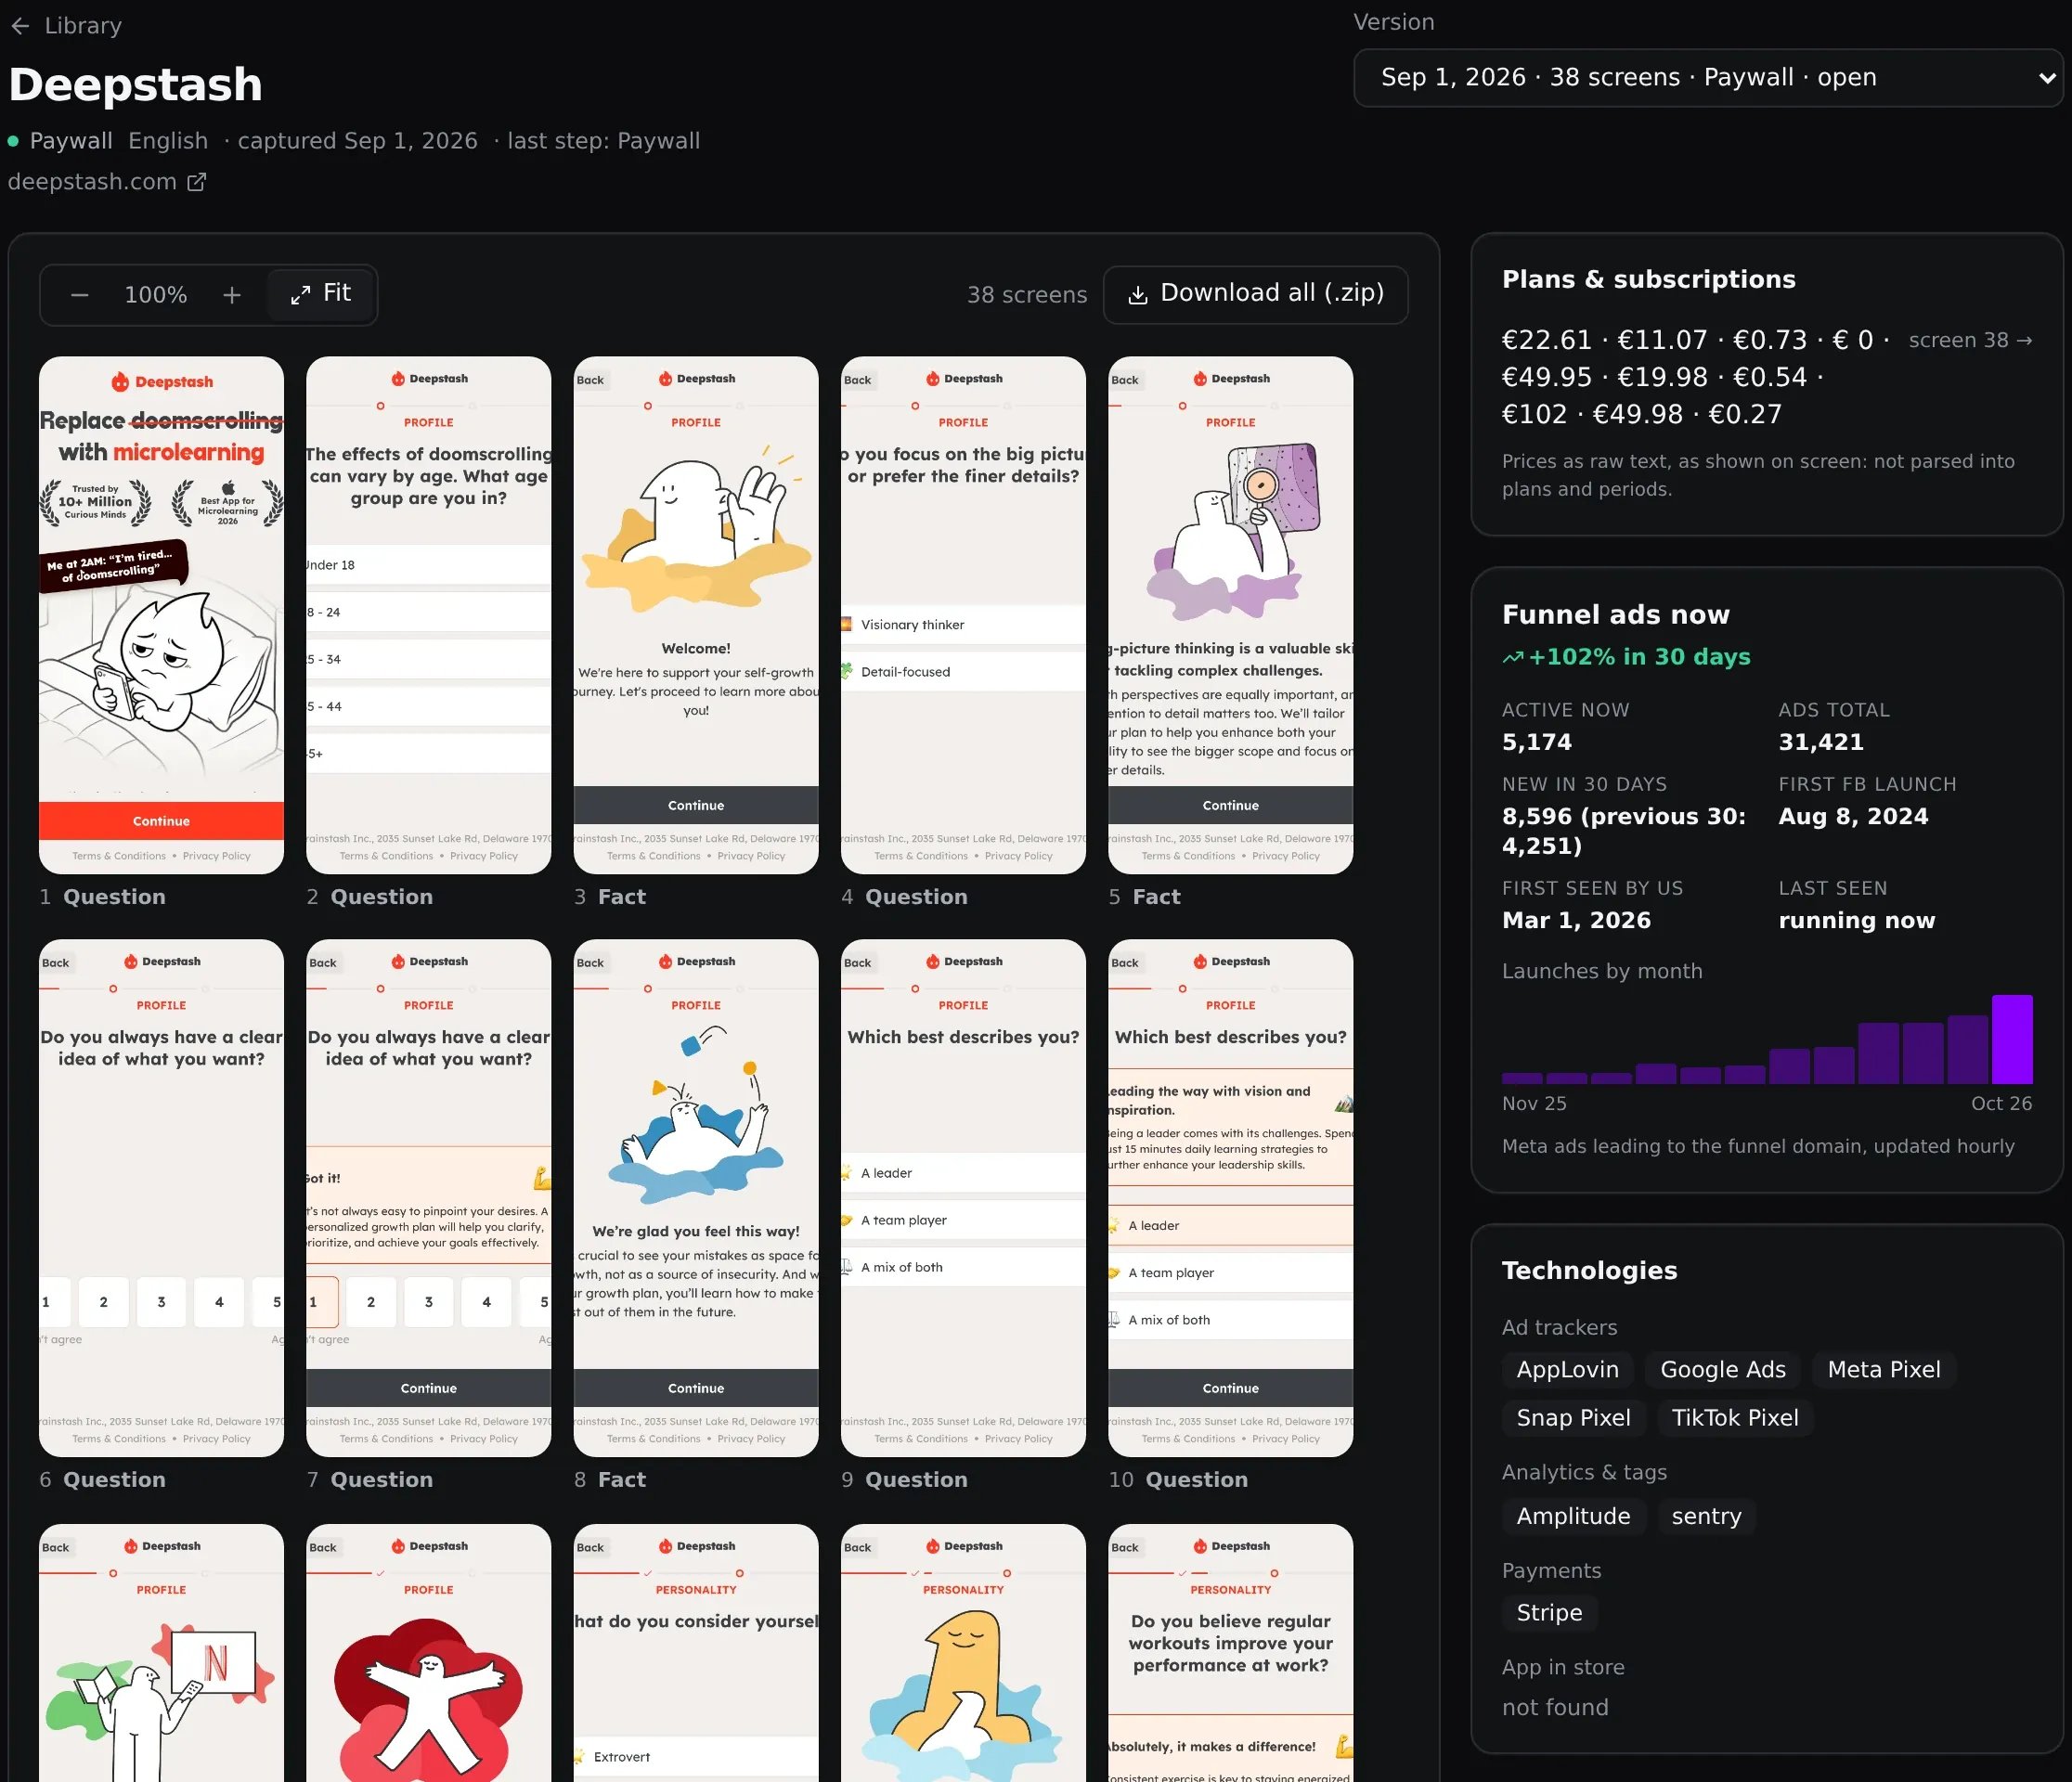
These differences suggest separate hypotheses for your own tests: the order of the opening steps, quiz length and the presentation of subscription choices.
06 · Access and payment
10 funnels are open to everyone; subscriptions start at $599/month
Access to 10 funnels of the week is available without a subscription. The “Month” and “Year + MCP” plans provide access to the Web2App section.
Start on the Web2App page: the open selection lets you explore funnel examples before choosing a plan.
| Access | What is available | Price |
|---|---|---|
| No subscription | Full access to 10 funnels of the week. Everyone sees the same selection, which changes weekly. All other funnels are blurred | Free |
| Month | All other funnels, ad creatives and advertising activity by month | $599/month |
| Year + MCP | All other funnels, ad creatives and advertising activity by month. MCP: a funnel market summary covering categories, brands and funnels of the week | $5,388/year |
The “Month” plan is billed monthly. “Year + MCP” costs $449/month when billed annually, saving $1,800, or 25%, compared with monthly billing.
MCP in the annual plan lets you connect a funnel market summary to an AI assistant, including categories, brands and funnels of the week. Payments are processed through Stripe, and you can cancel at any time. Choose a plan in the Web2App pricing section.
FAQ
What is a Web2App funnel?
It is the path from an ad through a web quiz to an app subscription offer. In Spytrend, you can explore quiz questions, selected answers and paywall pricing.
Can I view funnels without a subscription?
Yes. The Web2App page gives everyone access to 10 funnels of the week.
Does 1.3M ads represent the all-time total?
No. It is the number of new Web2App ads recorded in Spytrend’s database in September. The chart shows monthly activity; October was still in progress on the date of the data.
Why compare ads and visuals separately?
They show different aspects of advertising. For example, WalkFit had 340.2K ads and 29K visuals in July–September, while FitMe had 102.4K ads and 60.7K visuals.
Is pricing available for every funnel?
Paywall pricing is available for 1,424 of the 2,027 funnels. The Outcome shown on each card indicates how far the saved journey reaches.
How do the “Month” and “Year + MCP” plans differ?
Both provide access to the Web2App section. “Month” costs $599/month. “Year + MCP” is billed annually at $5,388, equivalent to $449/month, and includes a funnel market summary connected to an AI assistant through MCP.
Open funnels of the week — explore without a subscription
Explore the open Web2App examples: quiz questions, screen sequences and subscription offers. Choose a plan to work with the library and statistics.