In August 2026 Yellow Web compared five spy services — platforms that collect advertising from social networks and let you search it. Everyone got the same task: find iGaming ads (online casino, betting, lotteries) in Spain for 1 August and for the week of 26 July to 1 August, take the first hundred ads in each window and compare what Spytrend, Tyver, AdWall, Gamler and MTWSPY returned. The task was carried out by an AI agent. The author published the tooling openly, so the test can be repeated. The original test — «Five spy services through the eyes of an AI agent»
We are the Spytrend team, one of the five services tested. We took the same ad samples, ran the same search over them and are publishing both runs: the one the agent got in the test, and the one you get with the service's standard filters switched on. Some of the test's numbers we confirm as they stand. The rest is explained not by the size of the database but by how the agent queried it. The main takeaway for anyone working with AI search: the result is decided not by the model but by how the agent is connected to the data. You can check all of it without us — the script and both dumps are public.
Who was compared
- Spytrend (that's us) — a competitive advertising intelligence platform for Facebook and TikTok: about 1.8 billion ads, about 280 million new ones a month, classification across 33 categories and 342 subcategories, official AI-agent connectivity. The Pro plan is 79 USD a month.
- Tyver — a spy service with classification by a few broad verticals and results sorted by views; in the test it returned 11,497 ads for the week.
- AdWall — a spy service with 30 days of free access; in the test it returned 16,369 ads for the week, and 73 of the first hundred files turned out to be off-topic.
- Gamler — a niche service with its own classifier and a relaunch counter; the only one with no irrelevant ads in the test, but its volume is noticeably smaller.
- MTWSPY — a niche service with its own classifier and results sorted by views; 13% of its weekly output was off-topic.
Service descriptions checked against their sites as of September 2026 (Tyver, AdWall, Gamler, MTWSPY); the figures are from the Yellow Web test (August 2026).
- The author — the author of Yellow Web, who designed and ran the test.
- The agent — the AI agent the author handed the task to instead of searching himself: a program that made the requests to all five services and assembled the result.
- The wrapper — a home-made layer between the agent and the services: a command-line tool that took the agent's commands and turned them into requests. Whatever the layer did not pass through, the agent never saw.
- The measurement — the numbers the agent ended up with in the test.
- The repeat run — the same search, re-run by us on the same data but with the service's standard settings.
- Standard settings — how the service behaves when the filters that stayed off during the test are switched on.
- The author's cards — the very ad samples the agent collected in the test. We worked with exactly those, so the numbers stay comparable.
How the re-check works
A measurement is honest if it reproduces. We ran the same search on the same cards from the author: where the conditions matched, we quote his numbers as they are; where they differed from the standard ones, we show both runs side by side and name exactly what we changed. Every point below is built the same way: what the measurement showed → why it came out that way → what the repeat run produced.
What this re-check does not show.
- The test compared the first hundreds of results — that is 3.2% of our daily and 0.4% of our weekly volume: you cannot judge how far two databases overlap from that.
- The share of on-topic advertising was measured by the author on a hundred cards and is carried over to the whole volume as an estimate.
In brief
Three of the six discrepancies are explained by how the agent queried the service, not by what is in the database. The quota spend we confirm as it stands, and the comparison of search capabilities speaks in our favour by the test's own matrix.
- Volume of results. The agent took 996 ads out of Spytrend for 1 August, and 9,526 for the week. The database held 3,112 and 24,985 for the same query. → in detail
- Duplicates. The test never switched on the «Only Unique» toggle — the filter that collapses every copy of one creative (the image or video from the ad itself) into a single row. Without it, 55 different files were left in a hundred cards. With it, the same data yields 100 different creatives out of 100. → in detail
- Connecting an AI agent. In the test our agent server — MCP (Model Context Protocol, the official way to connect an AI agent to a service directly) — showed 0 successful calls out of 8 and 179 seconds per response. Our own logs for the author's session on 3 August show: 43 successful calls out of 43, zero errors, 1.6 seconds on average. The difference came from the author's home-made layer between the agent and the service: it started a new agent session on every request. → in detail
- Search capabilities. In the Yellow Web test (August 2026), search by the visual similarity of the creative itself and by the Facebook pixel (the counter an advertiser places on their site) is noted only for Spytrend; search by a fragment of the tracking link and by a webmaster's network — every domain, page and pixel belonging to one player — is not in the test's comparison table. → in detail
- Cost of the test. The whole test drew 201 tokens — that is an internal unit of the Spytrend quota, not a language-model token. Against the Pro plan's monthly quota of 40,000 units that is half a percent. → in detail
- Geo filter. Almost three quarters of the Spanish results are multi-geo: the ad runs in several countries at once and Spain is one of them. The author's agent counted such cards as misses, although under a Spain filter they belong there. On fresh results for the same slice there are no misses.
Thanks to the author of Yellow Web for a thorough test and open tooling. Below are all eight points: what the measurement showed, why it came out that way, and what the repeat run with standard settings gives.
The test's five main conclusions — and what the re-check showed
| Test conclusion | Re-check |
|---|---|
| MCP does not work: 0 out of 8 | 43 successful calls out of 43, 1.6 s on average → point 6 |
| 55 different files left out of a hundred | With the same sorting — the same 55; with the «Only Unique» filter — 100 out of 100 → point 4 |
| The databases barely overlap | What was compared were the first hundreds of results — 0.4% of the volume, not the databases → point 5 |
| 996 ads in a day | That is what the agent took out; the database held 3,112 → point 2 |
| Five gaps in the filter matrix | Two crosses were marked in error; in the test (August 2026) search by visual similarity and by pixel is noted only for Spytrend → point 1 |
The eight disputed points of the test and what the re-check showed
| 1. Filters and creative search | In the test (August 2026) search by visual similarity of the creative and by pixel is noted only for Spytrend |
| 2. Database volume for the same dates | 996 is the size of the agent's sample; the database held 3,112 |
| 3. Cleanliness of the results | 96% on-topic by the author's own measurement |
| 4. A hundred creatives without repeats | The duplicates were in the collection settings, not in the database |
| 5. Database overlap | It cannot be measured from the first hundreds of results |
| 6. Connecting an AI agent | Our server appears twice in the test table under different names |
| 7. Quota spend | 201 tokens, half a percent of the monthly quota |
| 8. What a media buyer gets | More on-topic ads for the week than the other four combined |
What the method got right
How the test was run — and what the method got right
A public comparison of five services on a single task is rare work, and it was done more carefully than most reviews in this niche.
The design of the test: one and the same query — iGaming advertising in Spain — sent to all five services, across two windows: 1 August and the week of 26 July to 1 August. From each service the agent took the first hundred cards per window, downloaded the media files, checked questionable ads for relevance by watching them in full, and counted file matches between services using two kinds of hashes. What this method got right:
- Two hashes instead of one. Matches were counted by SHA-256 — the file's checksum — and additionally by PDQ and vPDQ, perceptual hashes of image and video. The second step catches recompressed and cropped copies that byte comparison misses.
- Separate counting. Cards, downloaded files and visual versions of one creative were counted separately. That is precisely why the test made it visible that «a hundred cards» and «a hundred creatives» are different numbers.
- Questionable videos were watched in full. Relevance was checked by watching, not by file name and not by ad text. The author's AI agent assigned every unique file to on-topic, irrelevant or questionable. Four files in our weekly hundred were off-topic — and that is our 4%: the outcome of watching, not of eyeballing.
- Open tooling and an honest frame. The author published the wrapper — his home-made layer between his agent and the services — and wrote plainly: «There is NO universal winner in this test, and that is fine». The design of the test is right: one query, the same dates, one country for all five. That is exactly why the result can be recalculated — which is what we did. And the recalculation gives a different picture from the test's final table.
What was confirmed
What the test confirmed
First, what we repeated and got the same numbers for. These are not disclaimers ahead of objections — they are results that reproduce.
- Multi-geo in the results. An ad often runs in several countries at once, and Spain is one of them on that list. The author's agent read such cards as not being for Spain. On today's results for the same slice there are no misses.
- 55 different files out of a hundred is true when sorting by views, which is how the agent took the results. On the author's cards we got the same 55 for the week and 87 for the day. The uniqueness filter was not switched on in the test, and without it that is exactly the result.
- The test cost more in quota. 201 units against 42 for Tyver. Back then we charged for downloading media, and the agent downloaded 200 files.
- There is junk in the results. 4% irrelevant cards for the week — that is our number from the test's own labelling: the author's agent reviewed every file.
- Through the home-made wrapper, MCP genuinely did not work. Eight calls, eight errors. What the server logs showed at the same time is in point 6.
1. Filters and search
Two gaps in the matrix were marked in error, and the competitors' unique filters were already in Spytrend during the test: the path from one creative to a webmaster's network
«Filter names sometimes create a false sense of a standard. The category in Spytrend, the vertical in Tyver and the niche in Gamler and MTWSPY are built on their own classifiers».
Spytrend has five gaps in the matrix. The author singles out cloaking, relaunches and separating gambling from betting among the competitors' capabilities.
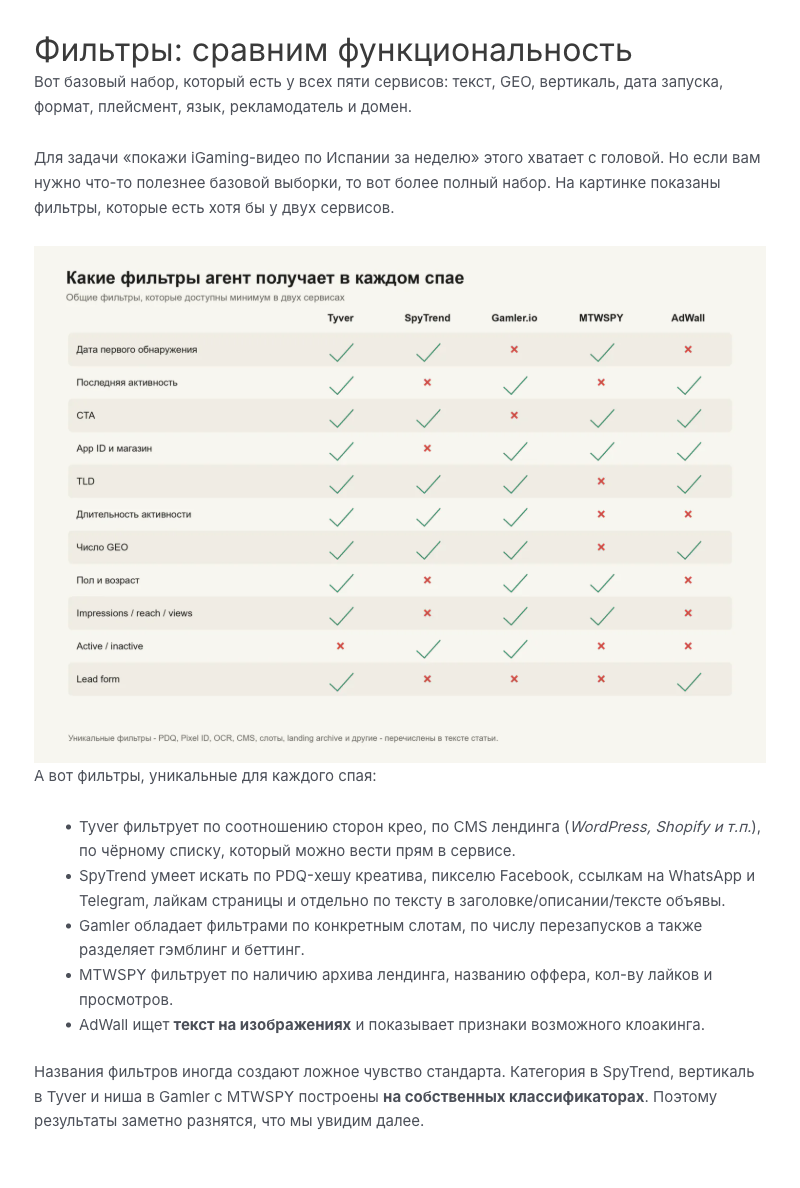
What the measurement showed. In the comparison table of capabilities — where the author collected what each service can search by — we have five empty cells: last activity, App ID and store, gender and age, impressions / reach / views, lead form. As for cloaking, relaunches and separating gambling from betting, which are listed as other services' unique filters, all three were in Spytrend during the test already, simply named differently: a cloak is a page swap, and such ads are selected through the Cloaked tab and the «Cloaked ads only» toggle; relaunches are repeat runs of the same creative from other accounts, switched on with the «Most re-uploaded» button, and the scale is visible right on the card; gambling and betting are searched separately, and there are eight subcategories for that.
Why it came out that way. Two of the five empty cells were marked in error: the filter by last activity was in place during the test, and so was search by application — a separate field takes an App ID, a name or a link, with the store selector next to it. The agent did not see them for the same reason it did not see «Only Unique»: the filter schema is served by the server, and the home-made wrapper never passed that layer through. Gender, age and impressions we withhold deliberately: Facebook treats the first two as its own estimate, and it does not provide impressions for commercial advertising at all. There is genuinely no filter for lead-form ads — that cross is fair. The eight gambling and betting subcategories are named: Online Casino Slots, Sportsbook, Crash and Plinko, Poker, Lottery, Esports Betting, Fantasy Sports, State Restricted Operators.
What the author noted, and what did not make the matrix. Search by visual similarity of the creative and by Facebook pixel were noted by the author in the study — that is visible in the chart below too. But two capabilities are missing from the matrix entirely: search by a fragment of the tracking link, and the jump to a webmaster's network — where one creative unfolds into the domains, pixels and fan pages (the Facebook pages the advertising runs under) of a single player. That part of a media buyer's work never made it into the comparison table.
What stayed as it was. Gender, age and impression range are not filterable in Spytrend. There is a separate problem with impression data for commercial advertising, and we go through it in point 4.
The real page behind the cloak can be revealed for $1
A cloak used to be a wall: you see the white landing page (the page the ad leads to), and what the competitor is actually running behind it is anyone's guess. Now the creative card in the Ads section has a button: Spytrend reaches the black version of the page itself, walks the funnel to the end through every redirect, installs and launches the app if the funnel leads to a PWA or APK (a web app or an Android installer), and extracts the operator's brand — casino, bookmaker, whoever.
A report on the whole chain lands in your account: screenshots at every step, where it led and how it ended; the landing page you need can be taken as a single archive. What to do next with a competitor's landing pages is in the guide to sites and landing pages in Spytrend. The price is $1 per run, on any plan. If it does not work, the money is refunded.
2. Database volume
996 ads is the size of the agent's sample, not of the database: the database held 3,112 for that date
«Spytrend, Tyver and AdWall turned out to have noticeably more ads. But a big number on its own says little about quality».
On the chart: Spytrend — 996 for 1 August and 9,526 for the week.
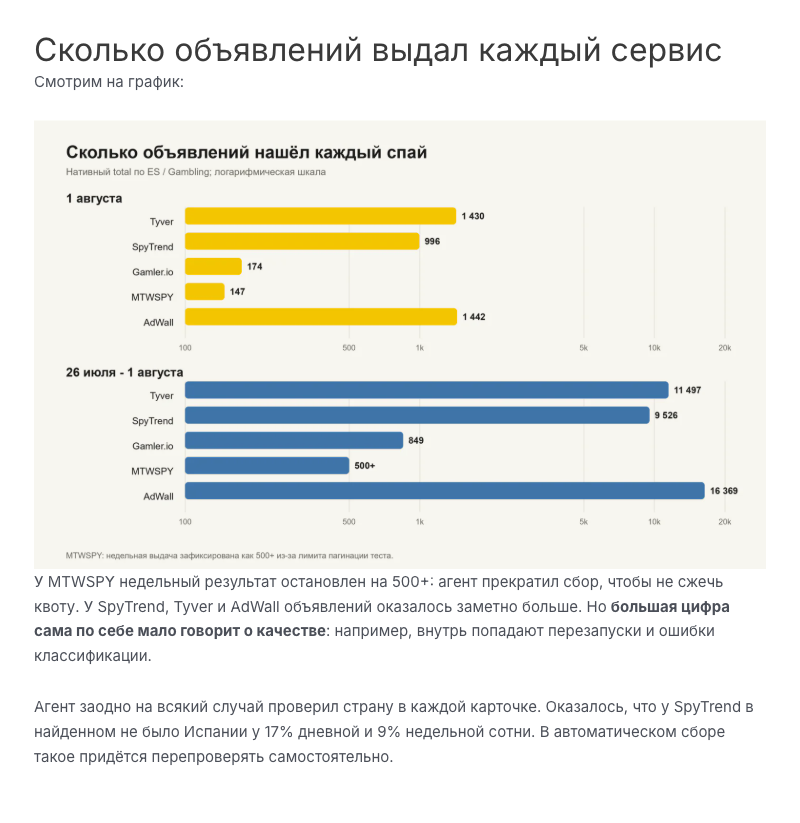
What the measurement showed. For 1 August the agent took 996 ads out of Spytrend, and for the week of 26.07–01.08 — 9,526.
Why it came out that way. At the time of the test the database held 3,112 and 24,985 for the same query. The difference came not from the size of the database but from how it was queried. Collection stopped at a hundred cards in each window and went no further. There are no errors, refusals or exhausted quota in our server log for those requests.
The repeat run. We continuously back-fill advertising for past dates: we find a new fan page, domain or webmaster network and add their ads to the results. That is why even a week gone by keeps filling up a month later. Measured on 11 September 2026: 4,072 ads in the database for 1 August, and 29,150 for that same week.
What this gives you in practice. Say you found a working combination a month ago — a creative, a page and a domain someone is scaling. Come back to it now: in the meantime other ads and connections belonging to it have appeared in the database for those same dates, and you can see how it was launched and scaled.
3. Cleanliness
96% of Spytrend's weekly results are on-topic iGaming, and that is the author's own measurement
«The daily samples from Spytrend and MTWSPY also came out clean. Over the week MTWSPY threw up 13% junk, Spytrend — 4%».
«With Tyver the quality depends heavily on the interval and the sorting. For a single day there is only 3% junk, for a week already 44%». «AdWall returned 73 irrelevant files out of 100».
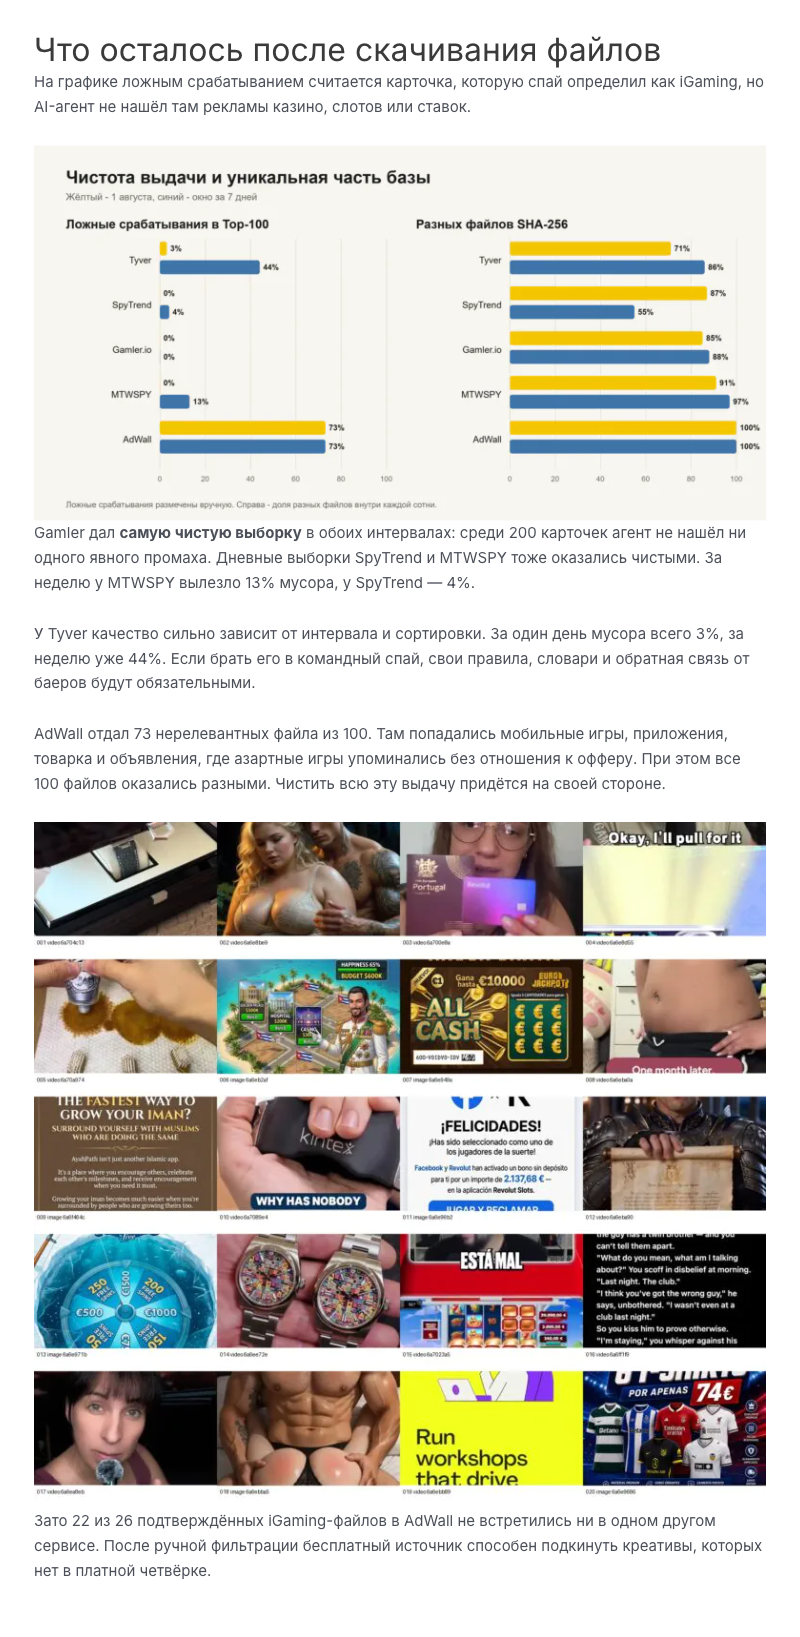
What the measurement showed. The author measured what share of the cards genuinely relates to iGaming: his AI agent assigned every unique file to on-topic, irrelevant or questionable, and watched questionable videos in full. We have 4% irrelevant over the week; the daily sample is clean.
What follows from this. The less junk in the results, the more time is left for going through creatives. Let us apply the share of on-topic cards from the author's sample to the ad volume and see how much on-topic advertising each service is left with.
For MTWSPY the agent stopped collection at 500+ cards so as not to burn quota — its 435 are counted from that sample, not from the database.
How this was calculated. For AdWall we apply 27% on-topic to a volume of 16,369 cards; for Tyver, 56% to 11,497. Both volumes are taken from the Yellow Web study's chart — we did not recalculate them. Gamler had no junk at all, but its volume is an order of magnitude smaller. On the date of the test Spytrend's database held 24,985 ads for that week, and 96% on-topic gives 23,986 — that is the figure comparable with the rest. The chart above shows the volume on the date of the repeat measurement, 11 September 2026: 29,150 ads and 27,984 on-topic. This is an estimate, not a recount: the on-topic share was measured on a hundred cards and carried over to the whole volume. Only an exhaustive check would give an exact number.
4. Duplicates
The duplicates lived in the collection settings: with the uniqueness filter you get 100 different creatives out of 100
«The most duplicates were found in Spytrend over the week: one file recurred across 28 cards, leaving 55 different files out of a hundred».
The measurement was made with sorting by views: «Tyver, Spytrend and MTWSPY can sort results by views».
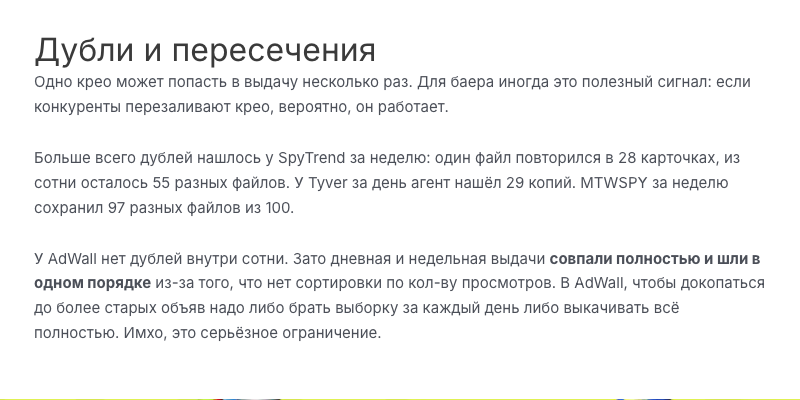
What the measurement showed. On the author's cards we got the same 55 unique files for the week and 87 for the day. The result reproduces; there is nothing to argue with here.
Why it came out that way. The agent collected results by views and did not switch on filtering by uniqueness. Sorting by views gathered ads from the oldest days of the week — by then they had been relaunched from different fan pages, and one creative took up 28 cards out of a hundred.
Sorting «by views» does not give you a gambling top — there is no data behind it
In the documentation for the Ad Library API — the open programmatic interface to Facebook's ad library — the impressions field is marked «Available only for POLITICAL_AND_ISSUE_ADS»: available only for political and issue advertising. And even then only as ranges, from «under 1000» to «over 1M». You can check this in the official description of the ad node: developers.facebook.com/docs/graph-api/reference/archived-ad.
For European advertising there is the eu_total_reach field — an estimate of reach across Europe: how many people saw the ad over its whole lifetime. But lifetime reach will not show you the best creative either: an ad that has been running for a long time simply had more time to accumulate an audience.
Most importantly, Facebook counts every upload separately. The same creative, raised from five different accounts, is five different creatives to it, each with its own impressions. It fundamentally does not know it is the same picture.
Spytrend glues such uploads together by the similarity of the image or video itself. That is why you can see what Facebook cannot: how many times this creative was actually relaunched. The relaunch count is not rounded into a range and is not lost on the next relaunch. What gets relaunched en masse is usually what pays off — which is why the relaunch count works as a signal. How to catch a scale-up by that signal we showed in the guide to creative trends and relaunches.
Repeat run, 11 September 2026. The «Only Unique» toggle in the first row of filters collapses every copy of a creative into a single row. On the same cards we get a hundred different creatives out of a hundred — no need to clean the results and recompute hashes on your side.
88 on the chart is our run sorted by date: that is how many distinct files come out in the daily window and in the weekly one alike, because by date it is the same hundred ads. The 87 in the text above is a different measurement: the author's daily hundred, collected with sorting by views.
How it works. The images and videos themselves are compared, not file names and not links. So a relaunch, recompression, cropping or a change of subtitles do not stop the same creative from being recognised. Next to every creative you can see how many ads it appeared in — it is immediately clear what gets relaunched most.
And one more thing. The repeats themselves are not junk. One creative across 28 cards means the combination is being scaled: that is a reason to take a closer look and check how it is being rolled out.
5. Database overlap
What was compared were the first hundreds of results, not the databases as a whole
«I counted matches in results between services by SHA-256 and then additionally by PDQ».
«Over the week, 92-100% of each source's files were not met in the first hundred of the others. Even Gamler and MTWSPY, similar in profile, overlapped on just seven files».
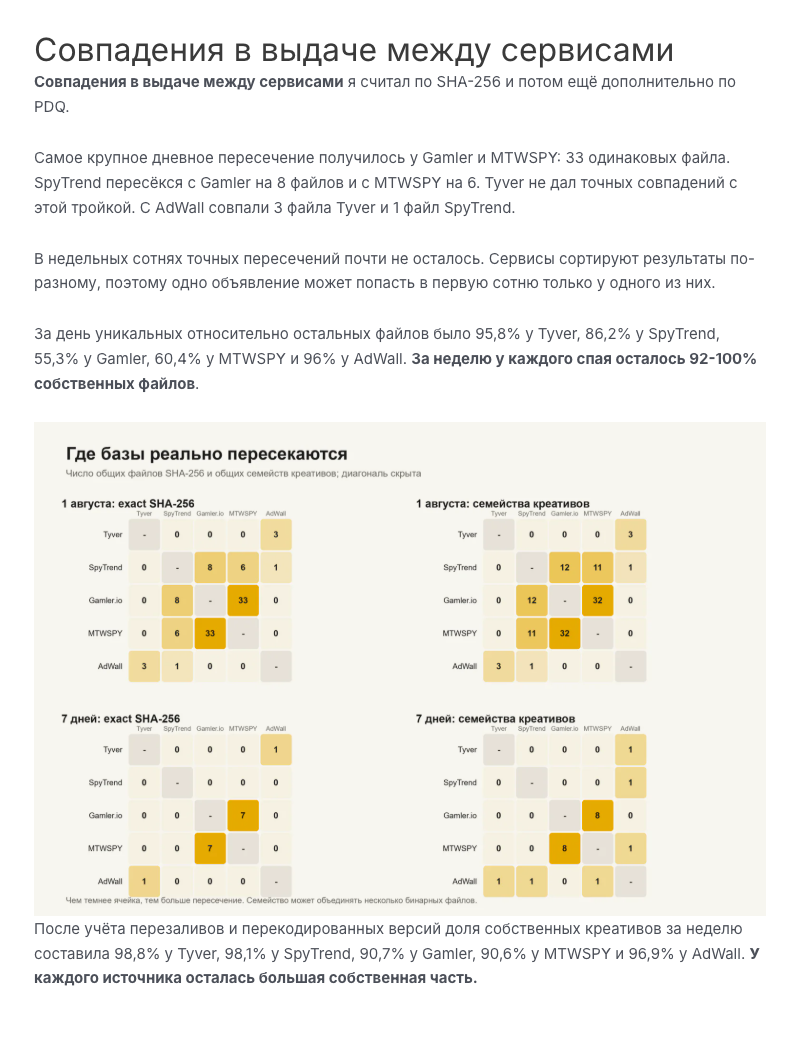
What the measurement showed. For every service, 92-100% of files were not met in the first hundreds of the others. For us, after accounting for relaunches, such files come to 98.1%.
The figure is the same for all five — which means it is not about the databases. It is computed over a hundred cards, regardless of what stands behind that hundred. Over the week of the test Gamler accumulated 849 on-topic ads, and we had 23,986, yet the share of unique files for both sits in the same 92-100% corridor. A quantity that cannot tell a database of 849 ads from a database of 23,986 describes the sorting of results, not the data.
A hundred cards is fractions of a percent of the volume. That is 3.2% of the daily results for 1 August and 0.4% of the weekly ones. Two databases can overlap by half and still produce different first hundreds: different default sorting is enough.
The author got the perceptual check right. SHA-256 alone was not enough, so he added PDQ and vPDQ — a comparison of the images and videos themselves, not of bytes. The instrument is the right one, but it sharpens a comparison of hundreds; it does not turn them into a comparison of databases.
Plus a technical detail about files. SHA-256 is a checksum: it matches only when the very same version is downloaded. And an API can return the original, a compressed copy or a preview frame of one video. A perceptual check catches some of those cases, but a single frame and a whole video still cannot be matched directly.
How to measure database overlap. Compare by Library ID — the number Facebook assigns to an ad — and over the full results for a period, not over the first hundred. Then the same advertising is recognised as one ad in both services, and the overlap share is computed against the whole volume.
6. MCP in practice
Spytrend appears twice in the test table — but it is one and the same server of ours: the log shows 43 successful calls out of 43
«Spytrend MCP through a separate agent — 0 out of 8, 8 errors, average response time 178.96 s».
«Spytrend SDK with direct API access — 15 out of 15, 0 errors, 1.69 s».
«The problems showed up when working through MCP with Spytrend. First authorisation got in the way, then every call started a separate agent session and took about three minutes».
«By the way, the team updated MCP recently, so the problem is probably already solved».
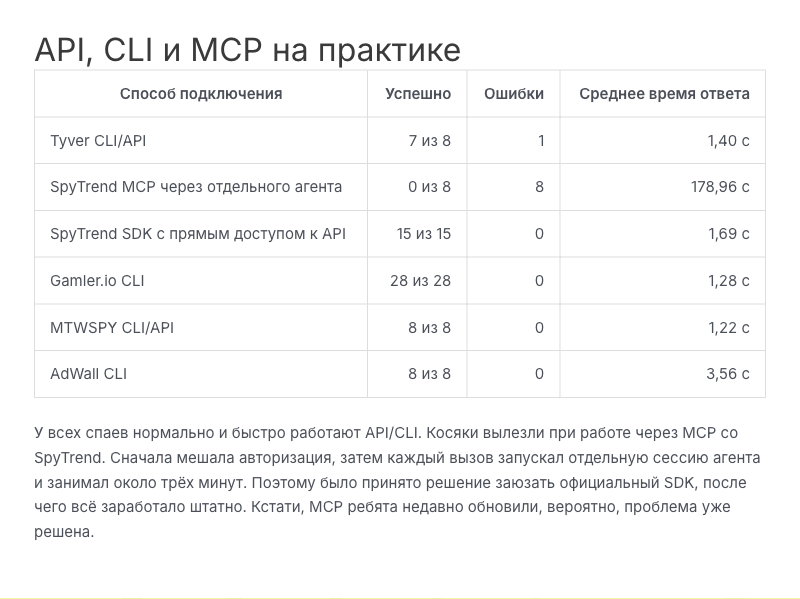
Let us start with that last quote. The author himself suggested the problem was already solved — and he is right. Below are the server logs, with dates, that confirm it.
What the measurement showed. There are two rows about Spytrend in the table: «0 out of 8» through MCP and «15 out of 15» through «the SDK with direct API access».
Why it came out that way. Both rows are one and the same server of ours. Spytrend has no separate SDK and never had one. The tool from the test goes to mcp.spytrend.com/mcp over OAuth2 client credentials — the standard sign-in scheme using a pair of keys issued to the agent. The «SDK with direct API access» row, with its 15 out of 15 and 1.69 s, is that same MCP, simply called differently.
So the difference between «0 out of 8» and «15 out of 15» is not in the server but in the wrapper. The author connected to our endpoints through his own command-line tool, and it started a new agent session on every request. Hence the 178.96 s: what that figure captured was not our response but the whole cycle — starting the agent, authorising, connecting, and only then the search itself.
The repeat run. What our log for 3 August shows: 43 calls, 43 successful, 1.608 s on average, a median of 0.163 s, zero errors. Responses running to almost three minutes do not appear in it at all. In repeat runs on 11 September 2026 we made ten calls in a row within one session: medians held at 0.77–0.93 s, with no errors.
But something else cost far more. MCP is not just a set of endpoints. The server itself tells the agent what it is working with: it hands over the filter schema, a live list of available sortings and instructions for each tool — what to look for, how to narrow the selection, which toggles exist. A home-made wrapper loses that layer: the data arrives, the hints do not.
So the agent searched by filters unsuited to this task and never found «Only Unique» — the very filter that has been in the description of our search tool since June and collapses repeats with a single value. That is where the 55 files out of a hundred in point 4come from, and part of the gaps in the filter matrix from point 1. The server did not hand over too little — the wrapper never asked.
What changed after the test. Sorting by impressions no longer passes silently: the server rejects the request, names the working options and shows an example call —
date (by date), most_popular (popularity ranking),
folder_added (by saves to folders) and most_reused_creative
(by number of creative relaunches). An agent connecting directly will not take that wrong turn again.
7. Quota spend
The whole test cost 201 tokens — half a percent of the monthly quota
«Spytrend drew quota mainly for downloading 200 files». The spend in the test was 201 units on the Pro plan at 79 USD/month.
«Services count views, file downloads and API requests differently, so a fair price per thousand cards is unfortunately not obtainable here».
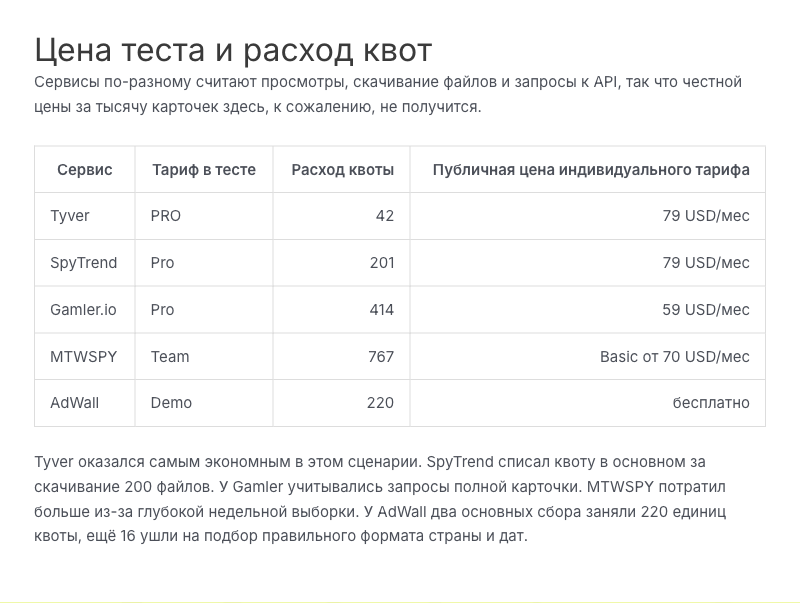
What the measurement showed. The whole test drew 201 tokens from us and 42 from Tyver. A token here is an internal unit of the Spytrend quota; it has nothing to do with language-model tokens.
Why these numbers are not directly comparable. Every service has its own price list and its own monthly limit, so the same number on different plans means a different share of the subscription. There is only one comparable quantity here — the percentage of the monthly quota.
What that is in percent. The Pro monthly quota is 40,000 tokens. The test took 201, which is half a percent. The plan would carry such a run about two hundred times a month.
Why it came out that way. At that point paging through metadata was free; you paid only for downloading media, and the agent downloaded 200 files.
What changed. The price list is different now and simpler: you pay for what you actually received.
| What | Tokens |
|---|---|
| A row in search results | 1 |
| An ad's media file | 1 |
| Media of a unique creative (one version instead of every relaunch) | 10 |
| A row from the TikTok corpus (a separate TikTok advertising database) | 100 |
| Pro monthly quota | 40 000 |
A short page returns tokens automatically: ask for twenty rows and twelve are found — twelve are charged. The same test today would cost about 865 tokens, a little over two percent of the monthly quota. Checking the balance is free for the agent.
8. Volume verdict
Over the week of the test Spytrend had 23,986 on-topic ads — almost four times more than the next service
«Spytrend is interesting for its built-in duplicate search (…) and for having TikTok, for anyone running several sources. The daily results came out clean, and over the week there was little junk».
«There is NO universal winner in this test, and that is fine».
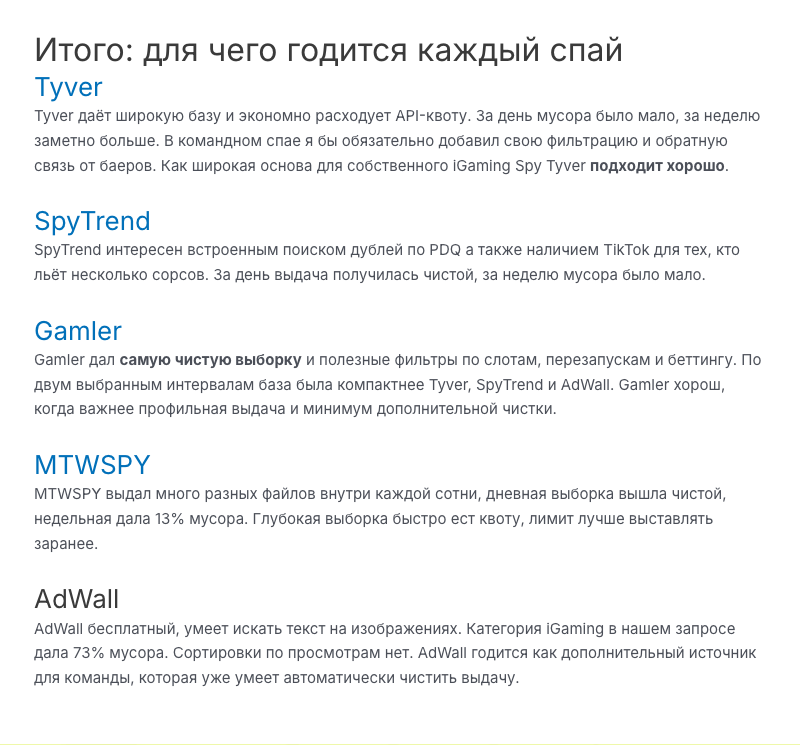
The method of the test describes collection settings, not databases: results were taken by a metric commercial advertising does not have, the uniqueness filter was never switched on, and databases were compared by hashes of different versions of one file. Remove those three things and count again, and the picture turns into its opposite: by the number of on-topic ads Spytrend leads every one of the four services by a multiple. Add about 280 million new ads a month, 342 subcategories, deduplication behind a single button, webmaster networks, TikTok and official AI-agent connectivity. In this comparison of five services, Spytrend comes first by estimated on-topic results for the test week.
First, on comparability. The volumes for the four services are taken on the date of the test, August 2026. To keep the comparison fair we take our own volume on the same date: 24,985 ads for the week of 26.07–01.08, and 96% on-topic gives 23 986. We quote the second figure alongside: on the date of the repeat measurement, 11 September 2026, that same week has been back-filled to 29,150 ads, i.e. 27,984 on-topic. That figure is no longer comparable with the competitors' August volumes — we did not recalculate theirs for September.
| For a media buyer | Spytrend | The other four |
|---|---|---|
| Volume and cleanliness of the database | ||
| Estimated on-topic advertising for the week | 23,986 on the date of the test 27,984 on 11 September 2026 | Tyver 6,438 · AdWall 4,420 · Gamler 849 · MTWSPY 435 (collection in the test stopped at 500+) |
| Junk in the weekly results | 4% | Tyver 44% · AdWall 73% · MTWSPY 13% · Gamler 0% |
| Inflow of new ads | about 280M a month (Facebook alone — over 170M) | Tyver — 113M in 30 days (May 2026) · the others do not publish it |
| Classification | 33 categories, 342 subcategories | Tyver has a few broad verticals |
| Search capabilities | ||
| Collapsing duplicates with one button | yes | not noted in the comparison |
| Ranking by creative relaunches | yes | a relaunch counter in Gamler |
| Search by visual similarity of the creative | yes | not noted in the test; their sites list «similar» ads by page, domain, IP or advertiser |
| Search by Facebook pixel | yes | not noted in the test; no dedicated filter on their sites (Tyver and MTWSPY search by link fragment) |
| Webmaster networks: domains, pixels, fan pages, IPs | yes | not stated on their sites |
| Revealing the brand behind a cloak (new in September) | yes, paid | signs of cloaking in AdWall; MTWSPY claims cloak bypass |
| A second source — TikTok | yes | no |
| Connectivity and price | ||
| AI-agent connectivity (MCP) | yes, OAuth 2.1 | REST API at Tyver, AdWall and MTWSPY, no public API at Gamler; no MCP server stated |
| Price | 79 USD | 59 · 70 · 79 USD, AdWall — 30 days free, then paid plans |
The comparison uses the author's figures (the test, August 2026) and the services' public materials as of September 2026 — Tyver, AdWall, Gamler, MTWSPY. Estimated on-topic advertising: the on-topic share from the author's sample × the database volume for the same period.
Deliberately absent
What is deliberately absent from the filters
Not everything Facebook's ad output returns is worth presenting as fact.
- Audience gender and age. Facebook returns them as its own estimate, not a measurement: this is attribution built on an assumption about who saw the ad. Meta itself classes such metrics as estimated and sampled. A filter over such a field would project a confidence that is not behind it, so gender and age are not among Spytrend's filters. Not because there is nowhere to get them, but because we do not pass an estimate off as data.
What we changed
What became easier after the test
The test helped us see where the AI agent was short of hints. What has changed since August:
- The agent gets a hint on how to sort. A request by impressions used to go through even though there is no data for such sorting. Now search explains the reason and offers options:
date,most_popular,folder_added(by saves to folders),most_reused_creative. You can choose fresh ads, our popularity ranking, or the most relaunched creatives. - Advertising can be analysed as a whole sample. We added analytics by advertiser, country, category and domain. The reach range is visible there too, with an explanation of what it means.
- We checked how the filters select ads. We went through all 45 search parameters and recorded where the results do not honour the conditions.
- Revealing the brand behind a cloak arrived — $1 per run, on any plan (details in point 1).
As for the «Only Unique» filter, «Most re-uploaded», search by visual similarity of the creative, by pixel and by a fragment of the tracking link, webmaster networks, TikTok and AI-agent connectivity — all of that was already in Spytrend during the test.
Connect over the official MCP and most of these difficulties disappear
The story of this test shows the main thing: the result of AI search is decided not by the model but by how the agent is connected to the data. Your own wrapper on top of someone else's API is an extra layer, and it is where the server's hints, the live list of sortings and readable errors get lost.
Spytrend has official MCP connectivity: Claude, ChatGPT, Cursor, Codex and VS Code work with the database directly, over OAuth. The agent sees the current filter schema, gets a hint instead of a silent refusal, and keeps one session instead of a new connection per request. The documentation is spytrend.com/mcp, and how the Spytrend MCP assistant works — in a separate guide.
Frequently asked questions
How is Spytrend different from Tyver for finding iGaming creatives?
By the author's measurement, 96% of Spytrend's weekly results are on-topic iGaming, while Tyver had 44% junk over the same week. The classification differs too: Tyver has a few broad verticals (as of September 2026), Spytrend has 33 categories and 342 subcategories, eight of them covering gambling and betting separately. Plus search by the creative itself, by pixel and by webmaster network.
Why did Spytrend show more duplicates than MTWSPY?
The results were taken sorted by views and without the uniqueness filter. In such a hundred, one creative took up 28 cards and 55 different files were left. On the author's cards we got the same result. With the «Only Unique» toggle switched on, a hundred cards yield a hundred different creatives.
Why did the Spytrend MCP server show 0 out of 8 calls in the test?
The author connected through his own wrapper, and it started a new agent session on every request — hence the average of 178.96 seconds. Our log for 3 August, for the author's session: 43 calls, 43 successful, 1.608 seconds on average, a median of 0.163 seconds, zero errors.
How many ads does Spytrend return for one day of iGaming in Spain?
The agent took out 996 ads for 1 August, with collection stopping at a hundred cards in each window. The database held 3,112 ads for the same date and the same query. Over the past month the history for that date has been back-filled: as measured on 11 September 2026 there are 4,072 ads, and 29,150 for the week of 26.07–01.08.
Can the overlap between two spy services' databases be measured from the first hundreds of results?
No. The test compared the first hundreds of results for a single query — that is 0.4% of our weekly volume. Different default sorting produces different first hundreds even for databases that overlap by half. Overlap has to be measured by ads' Library IDs and over the full results for a period.
How much Spytrend quota does a test like this use?
The author's test came to 201 tokens against a Pro monthly quota of 40,000 — half a percent. At that point paging through metadata was free and you paid only for downloading media. At today's prices the same test would cost about 865 tokens, a little over two percent of the monthly quota.
What can Spytrend not do, out of what the author checked?
Gender and age are deliberately absent from the filters: Facebook returns them as its own estimate rather than a measurement, and Meta itself classes such metrics as estimated and sampled. The geo filter selects correctly: most of the results are multi-geo, where Spain is one of the targets. There is no sorting by real impressions for commercial advertising and there cannot be: Facebook provides impressions only for political advertising.
How to check this yourself
The script repeats the measurement on your own account and prints a «claim → measured → verdict» table. You will need Python and access keys from a Spytrend account. No extra libraries to install:
export SPYTREND_CLIENT_ID=... # Settings → AI → Create agent access
export SPYTREND_CLIENT_SECRET=...
python3 verify.py
Repository with the data: https://github.com/Spytrend/yellowweb-test-verify
Inside: the script itself, the raw dumps of both runs — the test one and the standard one — the exact commands, the run dates and the tool versions. You do not have to take our numbers on trust; you can recompute them from the dumps.
A run uses about two percent of the monthly quota. If the results on your account differ from ours, write to us. We will check it and go through the discrepancy publicly, the way the author of the test did.
The test's five conclusions and what the re-check showed
| Conclusion of the study | What the re-check showed | Point |
|---|---|---|
| MCP does not work: 0 out of 8, 179 seconds | 43 successful calls out of 43, 1.6 s on average. Both rows of the table are one server | to item 6 |
| 55 different files left out of a hundred | With that sorting we got the same. With «Only Unique» we got 100 out of 100 | to item 4 |
| The databases barely overlap | What was compared were the first hundreds of results, not the databases: that is 0.4% of the weekly volume. The author's perceptual check: 98.1% of our files were not met in the others | to item 5 |
| Spytrend found 996 ads in a day | That is what the agent took out. The database held 3,112 for that date, and 4,072 today | to item 2 |
| Spytrend has five gaps in the filter matrix | Search by visual similarity of the creative and by pixel is noted only for Spytrend in the test (August 2026); tracking link and webmaster network are not in the test's matrix | to item 1 |
You do not have to take our word for any of it. Take the script, your own keys and your own combination — a run takes five minutes. If the figures diverge, we will go through the discrepancy just as publicly.
You can look at the database without paying: the free Starter plan, no card required, gives limited access to the archive of ads older than 90 days — spytrend.com.