Spytrend now has a Web2App section for researching web2app funnels: ads that lead to quiz funnels for subscription apps such as BetterMe, WalkFit, YogaGo, Lasta, Dressly and more than a thousand other brands. You can see who is launching how many ads, which creatives get duplicated thousands of times, and the funnels a bot has worked through to the end, including the paywall and pricing.
First, a clarification: “web2app” already has another meaning in affiliate marketing. It often refers to sending traffic to gambling apps through PWAs (progressive web apps installed from a browser) and deep links such as OneLink. Here, it means a different flow: someone clicks an ad, completes a quiz on a website, pays for a subscription on the web and only then installs the app. Payment happens before the app store.
The market figures in this article cover September 2026; October data is still being collected. Funnel library counts are as of October 22.
Why brands launch millions of web2app ads
There are several reasons, all tied to money.
Apple takes 15–30% of subscription payments, while web payment processing costs a few percent. In the US, external payment links are allowed following Epic v. Apple, but the court has yet to approve a commission rate for them. Apple is proposing 15%, and the case is ongoing. Outside the US, app store rules on external payments are stricter, so brands move payment to the web before installation.
The second reason is tracking. After iOS 14.5, install attribution became fragmented, while a website purchase can be tracked through a pixel and Conversions API (server-side event sharing with Meta). Teams run campaigns in Ads Manager optimized for website conversions, just as an online store would.
A quiz can also be changed in minutes without an app store release. Teams run funnel experiments every week and test creatives by the hundred.
Who is this useful for? Media buyers on product teams: the market grew out of Ukrainian companies (BetterMe and Headway came out of Genesis; WalkFit, Yoga-Go and Muscle Booster belong to Welltech), and web2app experience appears as a separate requirement in job listings. Teams building their own subscription business with tools such as FunnelFox. And affiliates working in nutra and physical products who want to study how a quiz warms up an audience—a mechanism that transfers to almost any vertical.
If you run CPA offers and do not have your own funnel, you will not find a ready-made offer here. This section is for people building or running their own subscription business, where profitability depends on renewals that cannot be seen from the outside.
Web2App market overview: ad volume and leading brands
The first tab shows monthly web2app ad volume and who is behind it. You can set the date range by month.
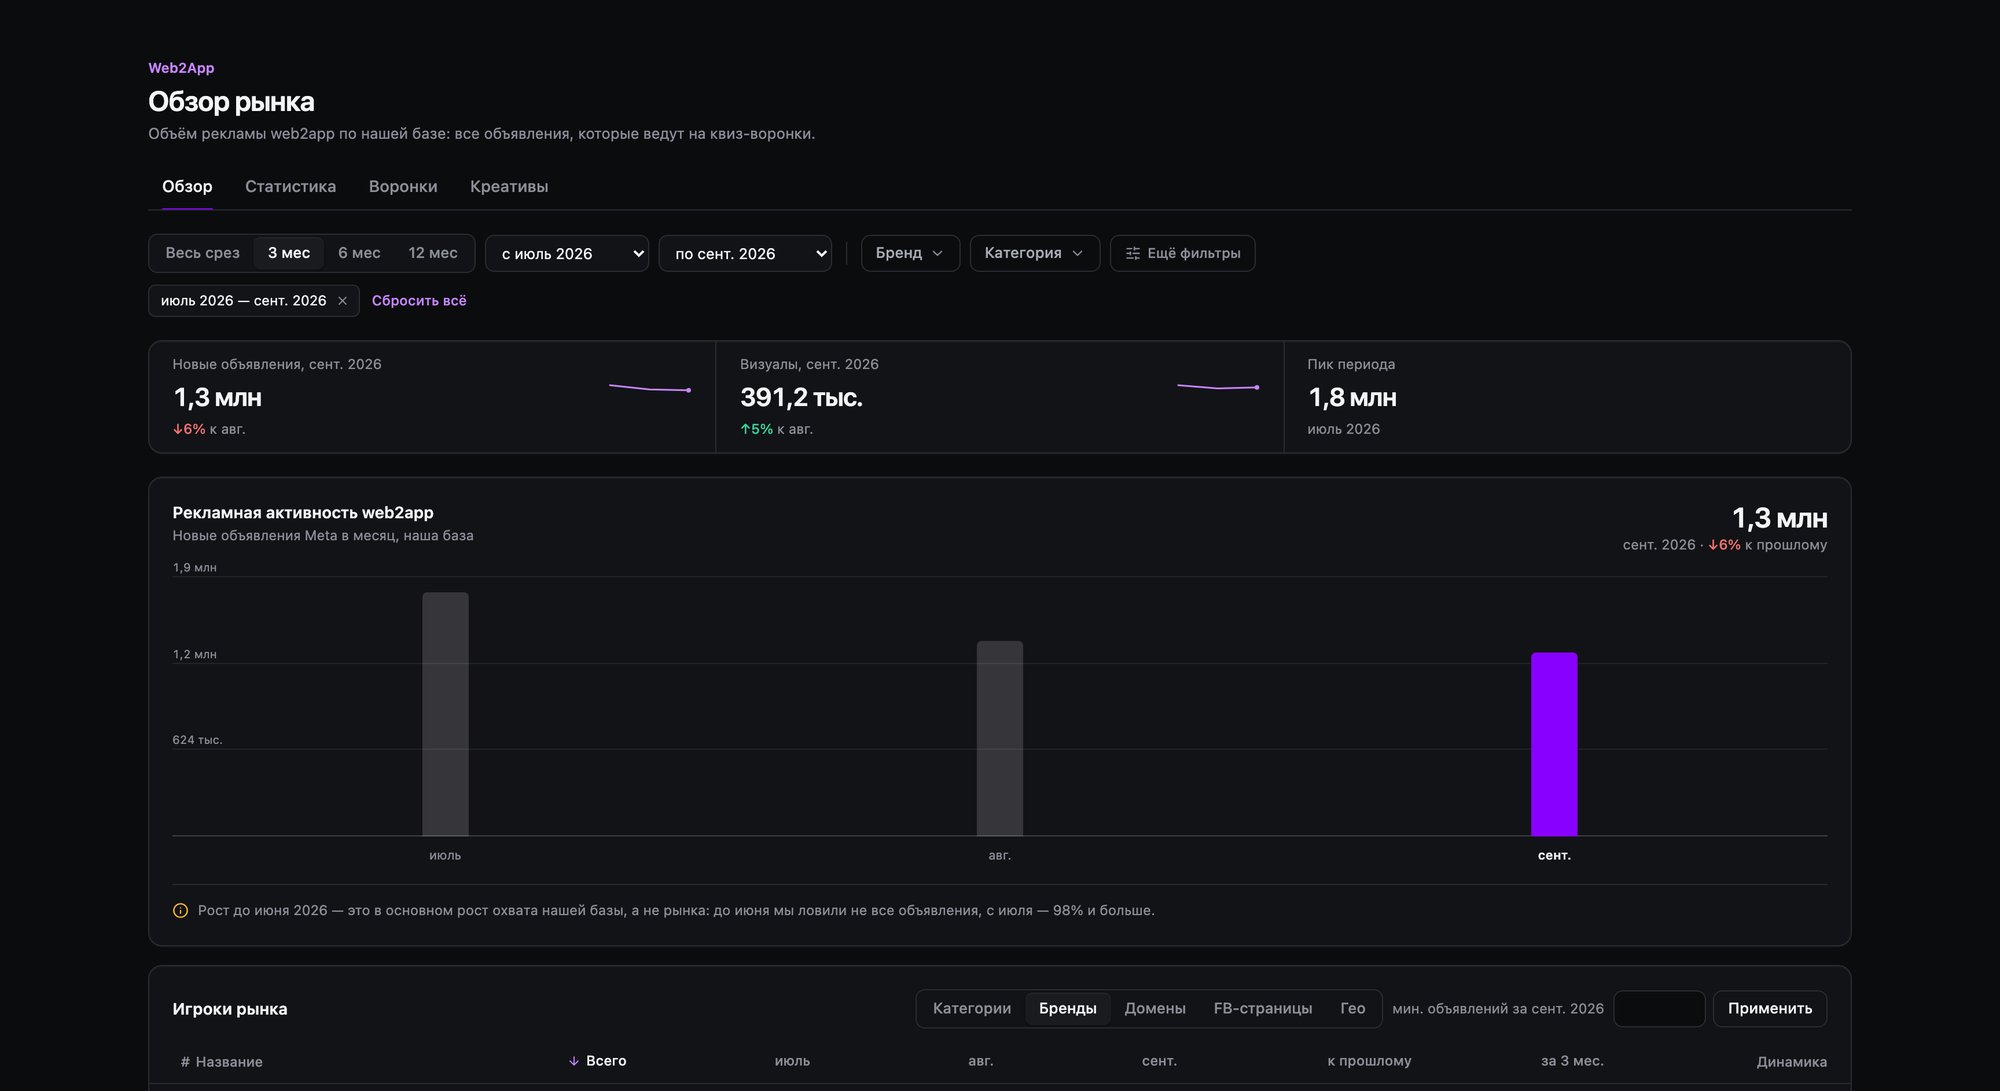
In September, the database recorded 1.3 million new ads leading to quiz funnels, down 6% from August. July was the peak at 1.8 million. Meanwhile, the number of visuals—unique creatives—increased to 391,200 in September, up 5% from August. Fewer ads, but more different creatives.
Keep the chart’s caveat in mind: growth through June mainly reflects expanding database coverage, rather than market growth. Since July, we have been capturing 98% or more, so July is the starting point for valid monthly comparisons.
Here and throughout the article, ad counts include copies. If the same video is launched 500 times, that counts as 500 ads and one visual.
Below the chart is a table of market players, with tabs for categories, brands, domains, Facebook pages and countries.
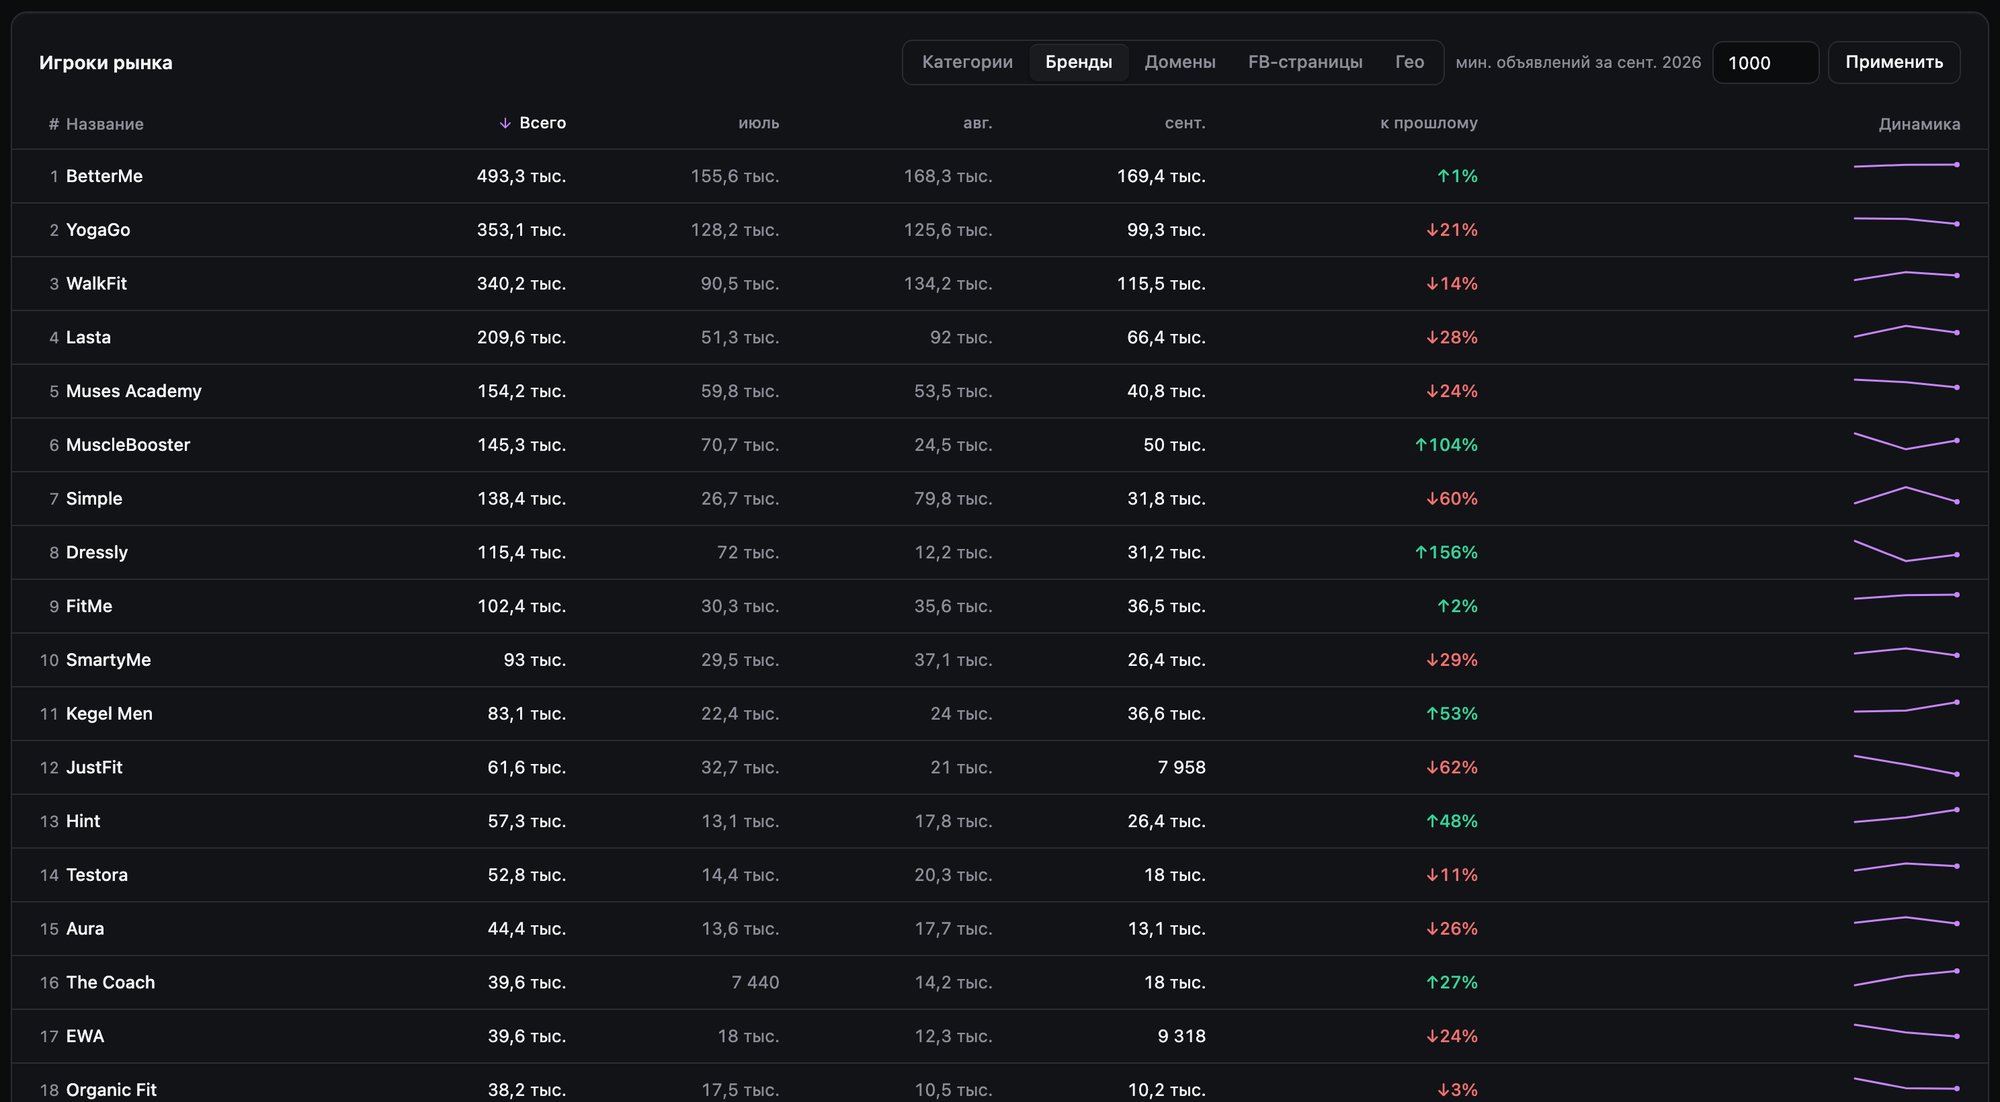
BetterMe led the brand rankings in September with 169,400 ads, up 1% from August. Next came WalkFit (115,500, down 14%), YogaGo (99,300, down 21%) and Lasta (66,400, down 28%). MuscleBooster more than doubled month over month, up 104%, but that looks more like a rebound: it had 70,700 ads in July before falling to 24,500 in August. Other notable growing brands included Kegel Men (+53%) and Hint (+48%).
Brands distribute that volume very differently. BetterMe’s September ads totalled 169,400 across 36,700 visuals, roughly 5 copies per creative. YogaGo had 99,300 ads across just 3,245 visuals, or around 30 copies each. Some brands test a broad range; others run a narrow set of creatives across a huge number of ads. Some copies are simply versions for different languages and countries. These figures do not show which approach is more profitable: there is no budget data here.
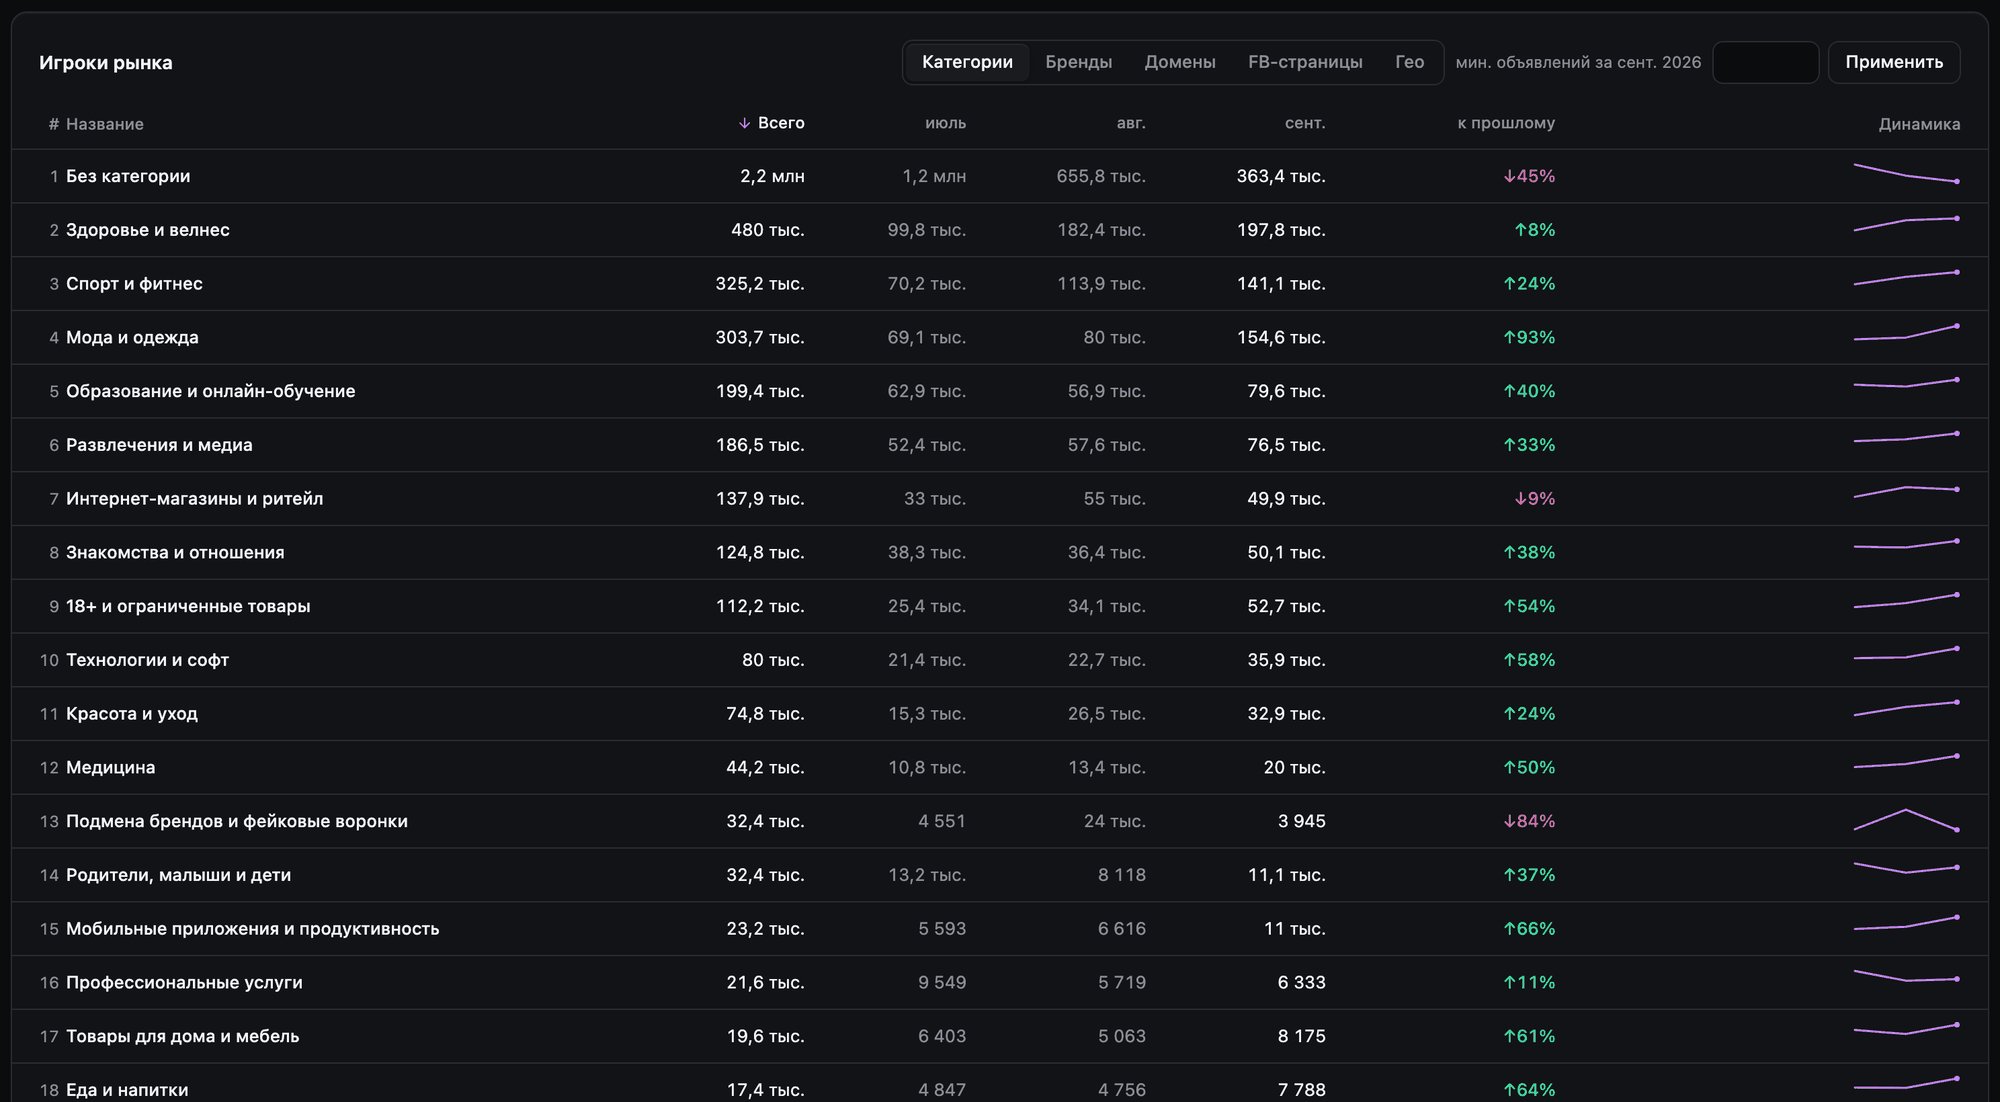
Categories. Health and wellness accounted for 197,800 ads in September, fashion and clothing for 154,600, and sports and fitness for 141,100, followed by education, entertainment and dating. Treat growth percentages in this tab cautiously for now: 655,800 ads were uncategorized in August, compared with 363,400 in September. Categorization is catching up with the database, so some category growth reflects newly classified ads rather than market growth. Look at absolute counts within a month.
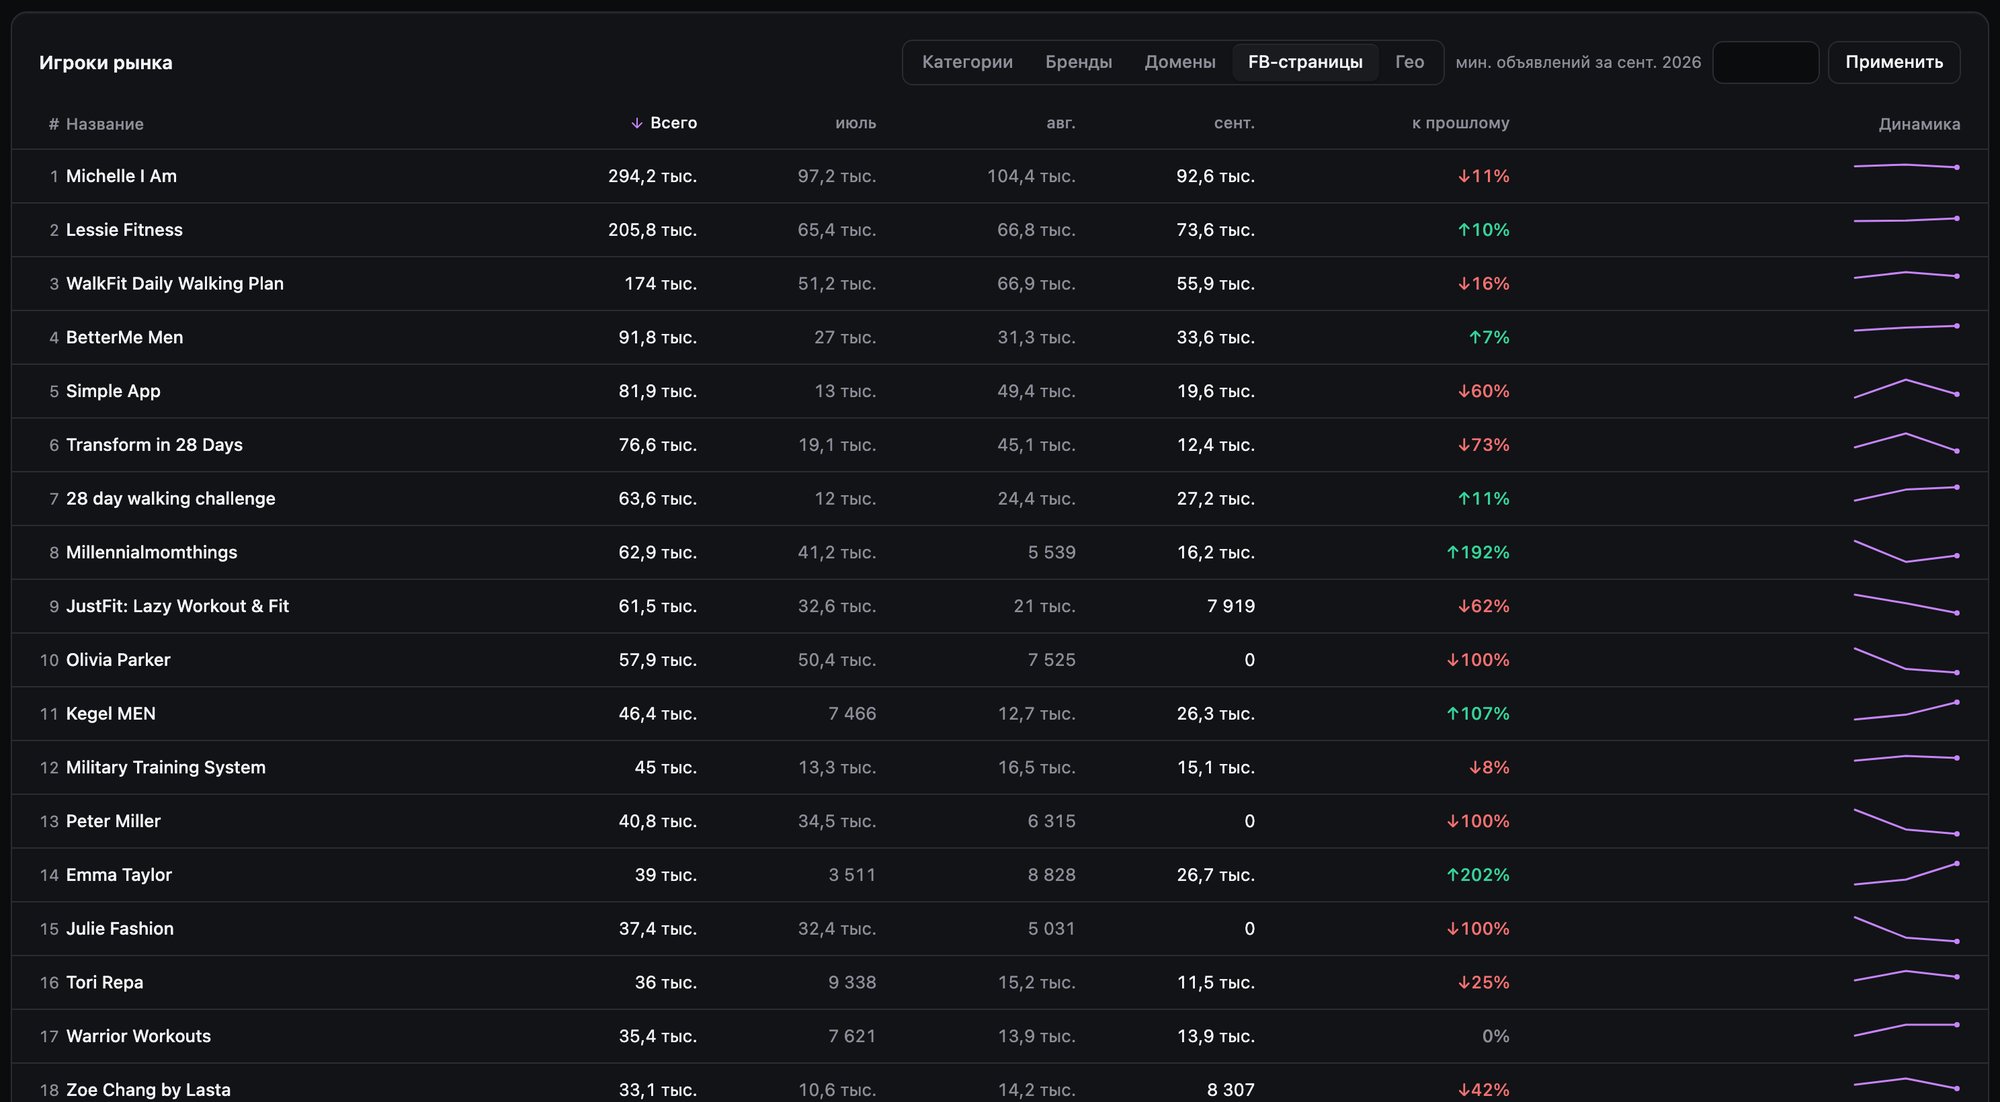
Facebook pages. This is the most useful tab for a media buyer. Volume comes from both brand pages and persona pages: Michelle I Am (92,600 ads in September), Lessie Fitness (73,600) and Emma Taylor (26,700, up 202% from August). Emma Taylor sends traffic to Lasta; WalkFit uses Master Wang Coach and Master Li Coach. The pitch comes from a “real” coach rather than a logo.
One caveat: a page in Spytrend represents a page, not a separate advertiser. One team typically runs ads through dozens of pages, so twenty pages sending traffic to one domain could belong to a single buyer.
Countries. One ad often runs in several countries, so country totals add up to more than the overall ad count. Compare countries within the same month.
Statistics: monthly web2app data by any dimension
The Statistics tab presents the same database as a large table, with 1,113 brand rows for July–September. The “Min. ads” field filters out smaller players: a threshold of 1,000 ads in September leaves 137 brands. You can group by brand, domain, category, Facebook page, country or language, then use the “Level” button to add a second grouping within the first. Counts can be shown as ads or visuals.
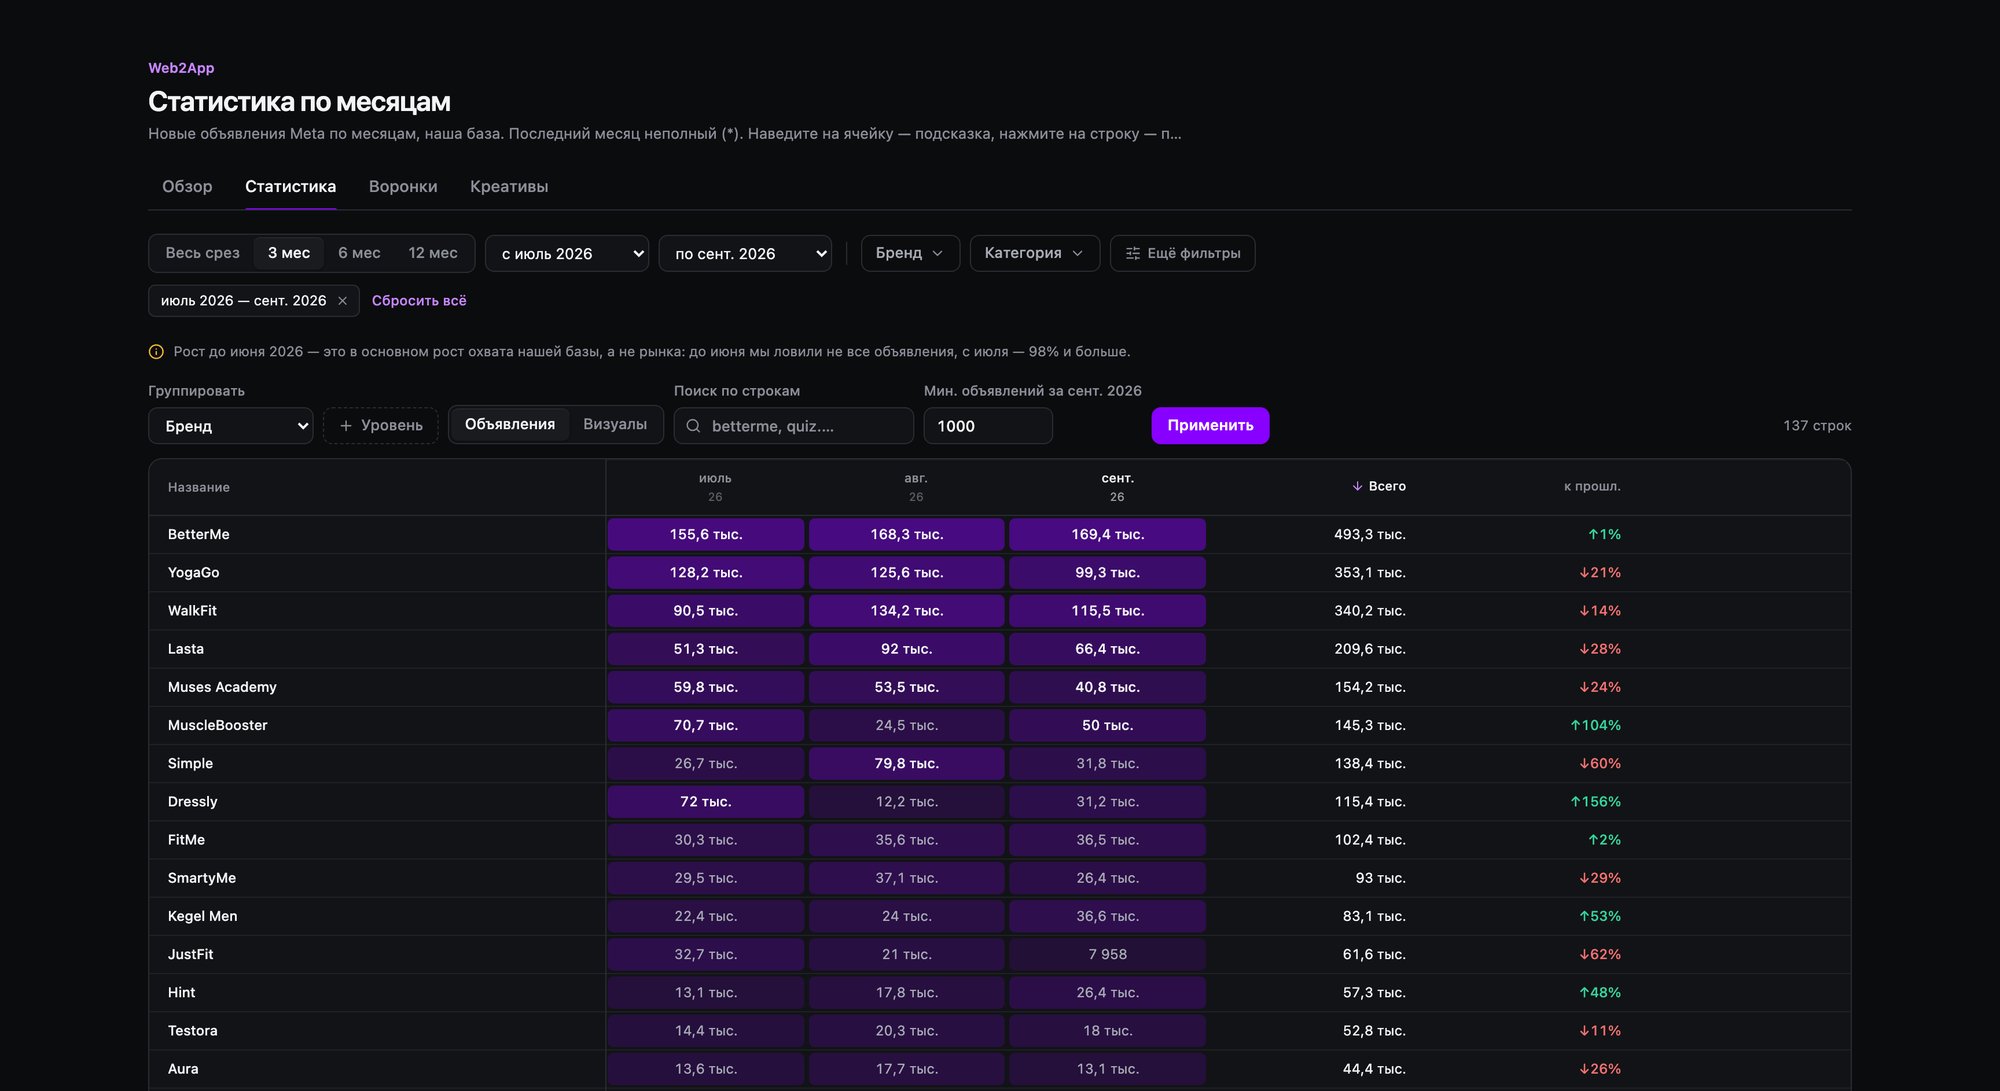
Click a row to open a detail panel on the right. Here is Dressly for the same period.
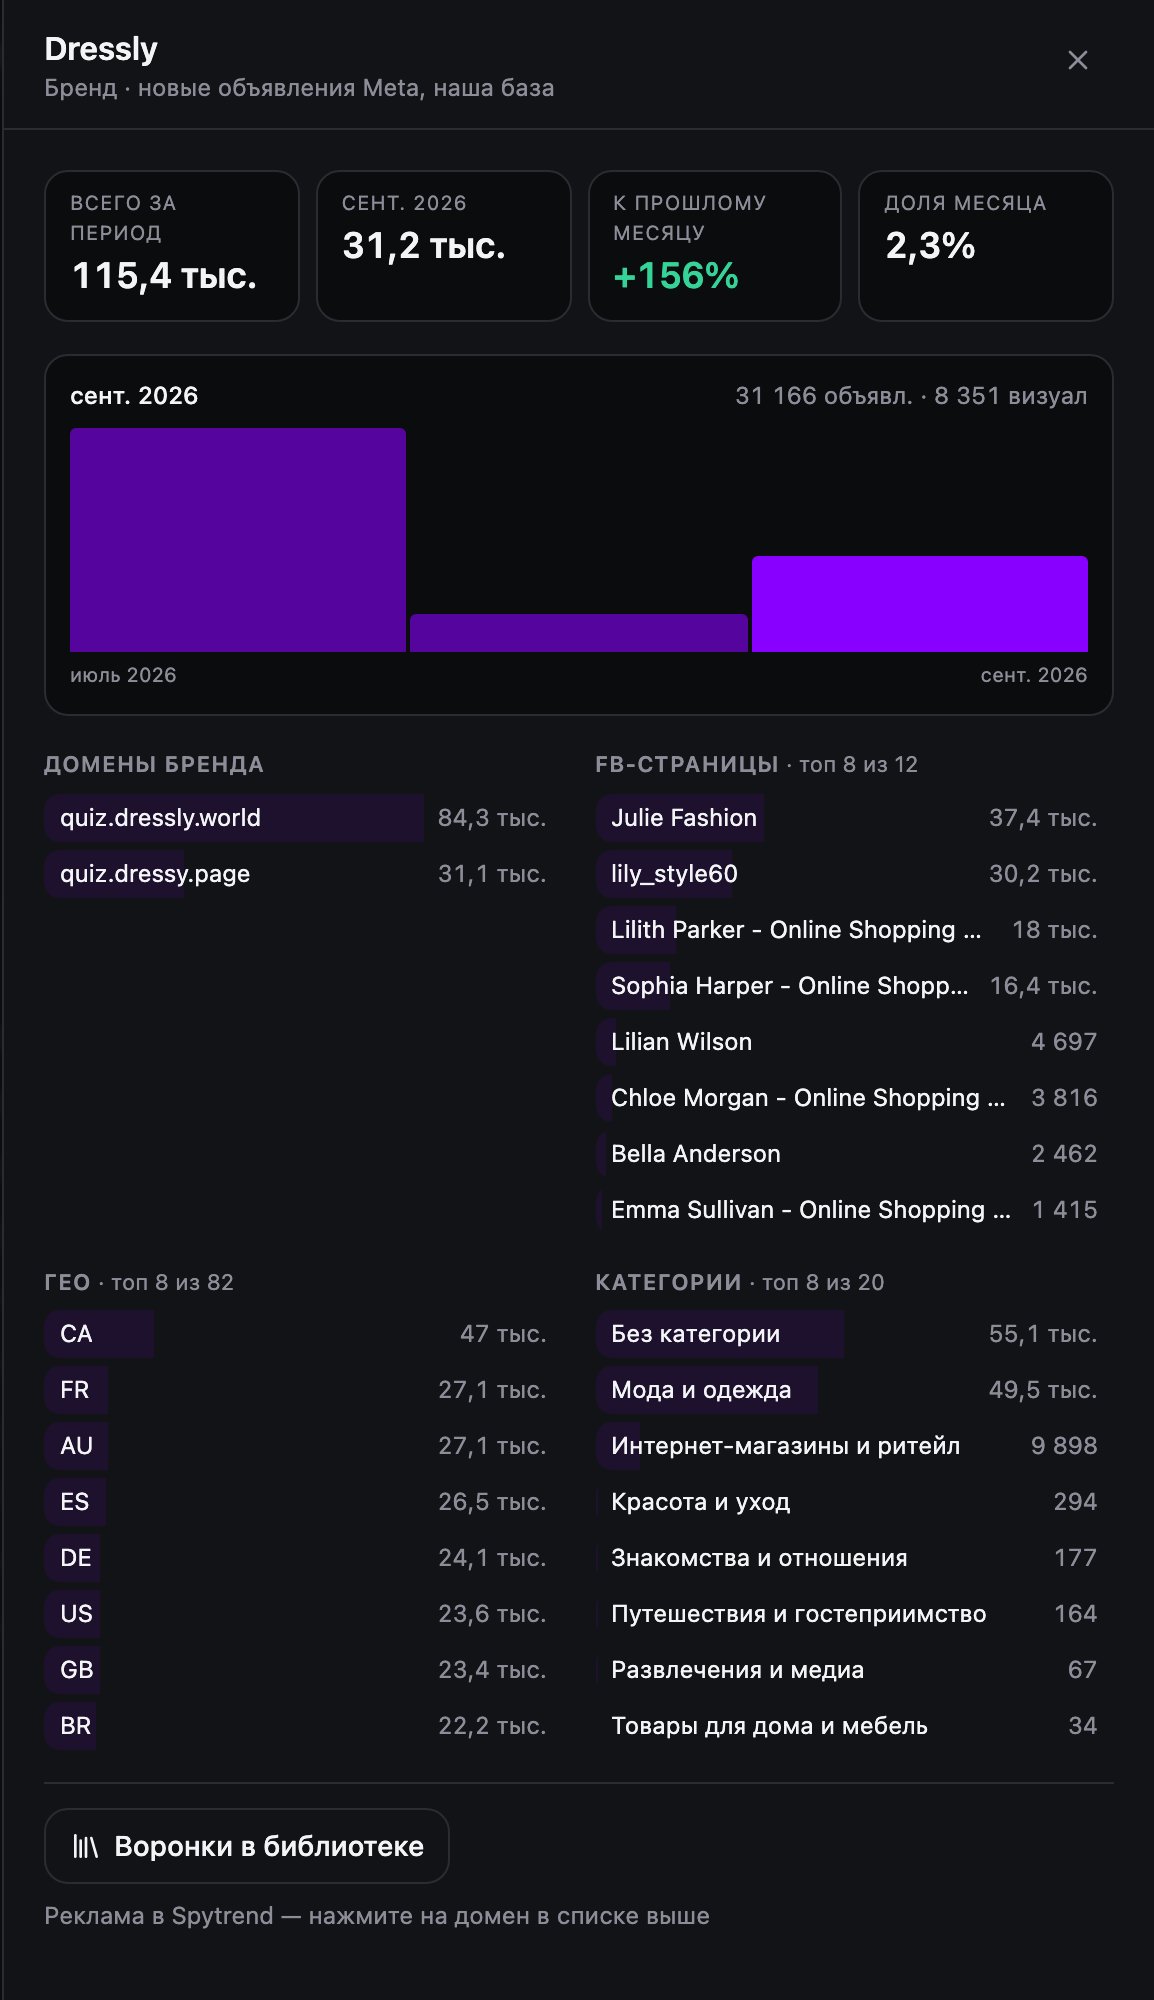
Dressly had 31,200 new ads in September, up 156% from August and accounting for 2.3% of that month’s entire web2app market. But where the growth came from is more interesting than the increase itself. The panel shows two domains. The old one, quiz.dressly.world, recorded 72,000 ads in July, 11,900 in August and 339 in September. The new one, quiz.dressy.page, first appeared in August with 253 ads, then received 30,800 in September.
The pages tell the same story. Julie Fashion, lily_style60 and Sophia Harper accounted for 32,400, 27,100 and 12,500 ads respectively in July; all three had zero in September. Almost all of Dressly’s September volume came from new pages: Lilith Parker - Online Shopping Expert (17,800), Lilian Wilson (4,700), Chloe Morgan, Bella Anderson and Emma Sullivan. Within a month, the brand changed both its domain and its roster of personas. The reason is not visible from the outside, but looking only at the old domain could easily suggest that Dressly had left the market.
Web2App creatives: copies, launches and ad activity
This tab contains creatives that lead to quiz funnels. There are four sorting options: currently active, most copies, new launches and recently seen running. You can also search ad text.
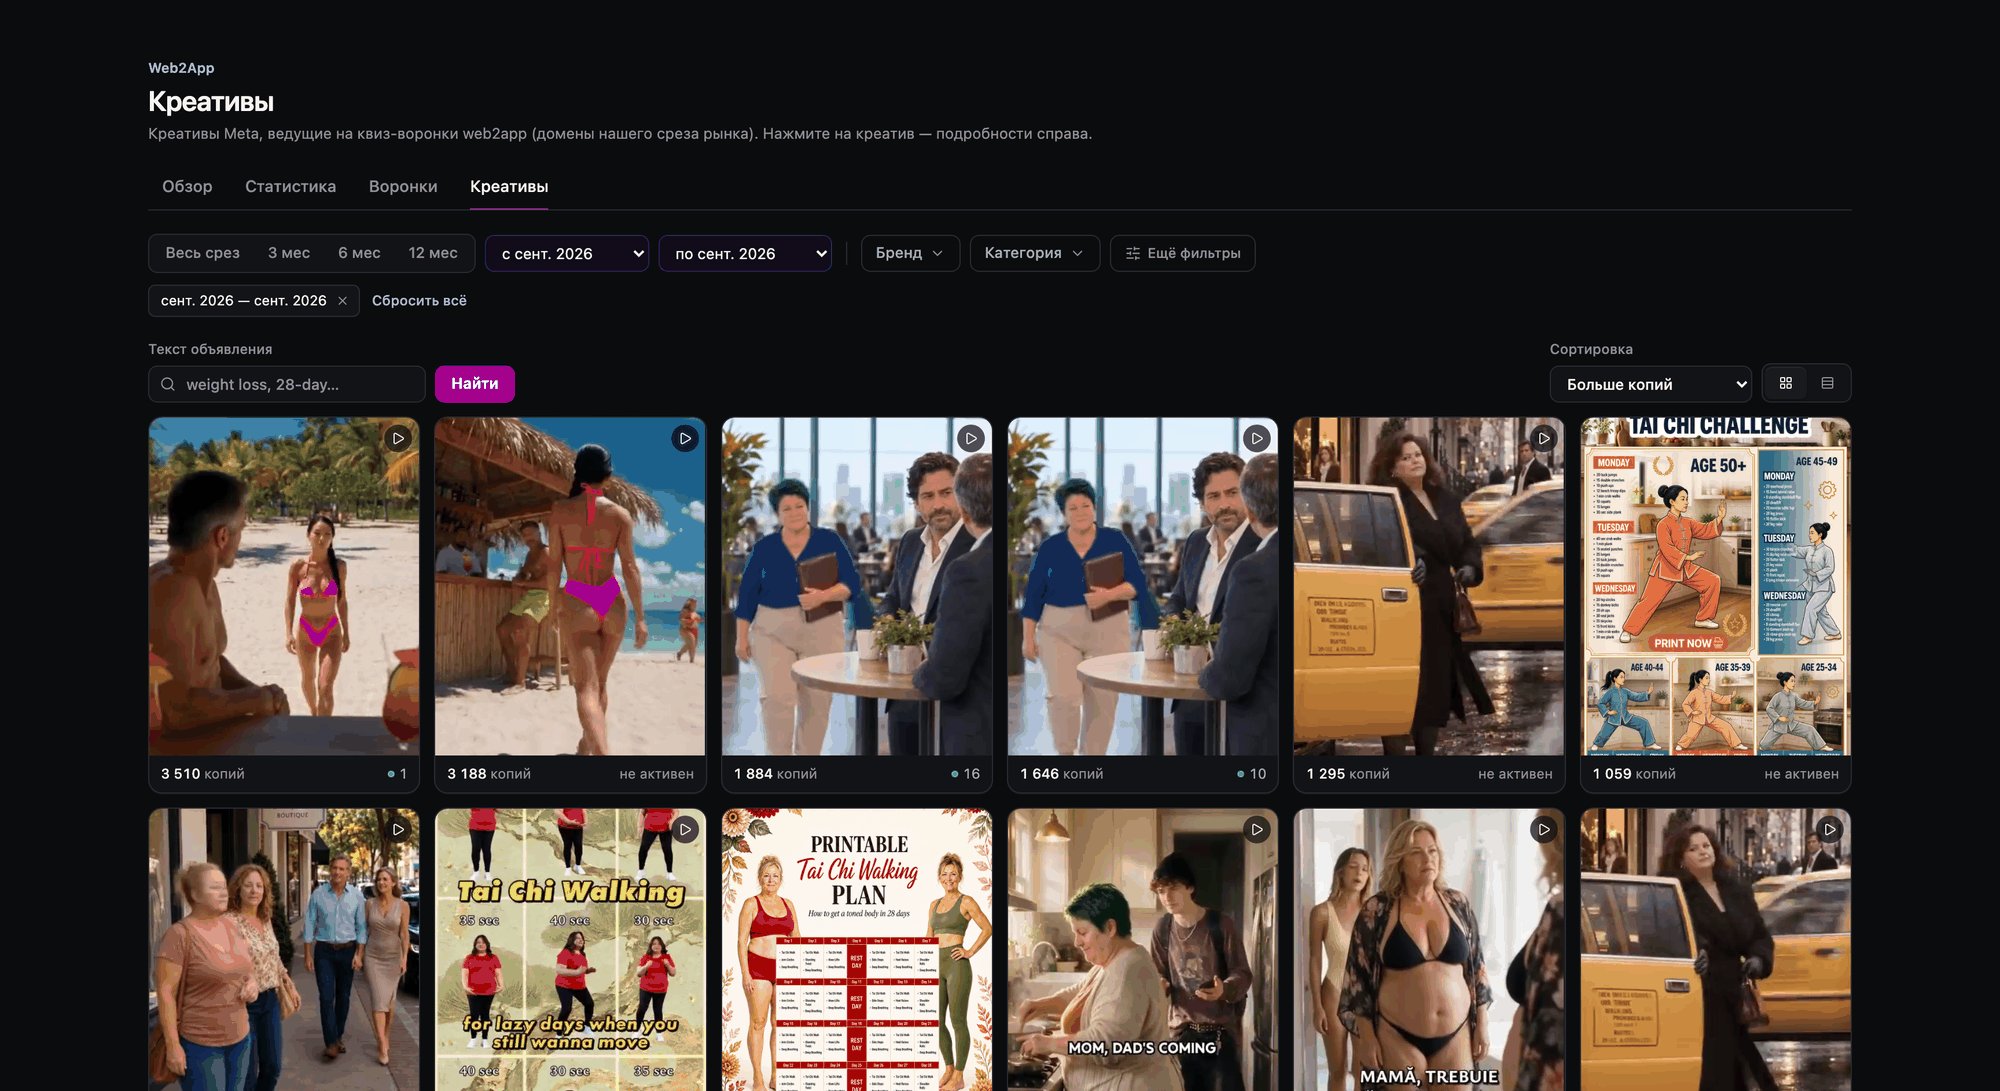
Copies are ads that use the same creative. This is a launch count, not impressions or traffic. The copy counter includes every ad using that creative, including ads launched later, in October.
YogaGo took almost all the top spots for September. The leading video accumulated 3,510 copies: it launched on September 3, and we last saw it on October 17. It runs through two pages, Yoga-Go: Yoga For Weight Loss and 28 Day Tai Chi Challenge, with the headline “Start training!” translated into at least five languages. Five of the month’s six most duplicated creatives belonged to YogaGo—the same “few creatives, many copies” strategy seen earlier.
A high copy count means a creative is being used widely. Its budget and revenue are not visible, so this signals a brand’s interest, rather than proving that the creative is profitable.
For an example we can follow through to the funnel, take WalkFit. Its Tai Chi Walking video, “for lazy days when you still wanna move”, launched on September 16 and had 894 copies at the time of writing. The detail panel shows weekly launches: 300 copies in September, followed by a week with almost no launches (15), then another 427 in the week starting October 8. It runs in the US, Hungary, the UK, Greece and Canada. There is one headline, “Join us now!”, translated into five languages. It uses nine pages (the panel shows the first eight), including more coaches: Master Wang Coach, Master Li Coach, Heather Walks and Alex Dong Tai Chi.
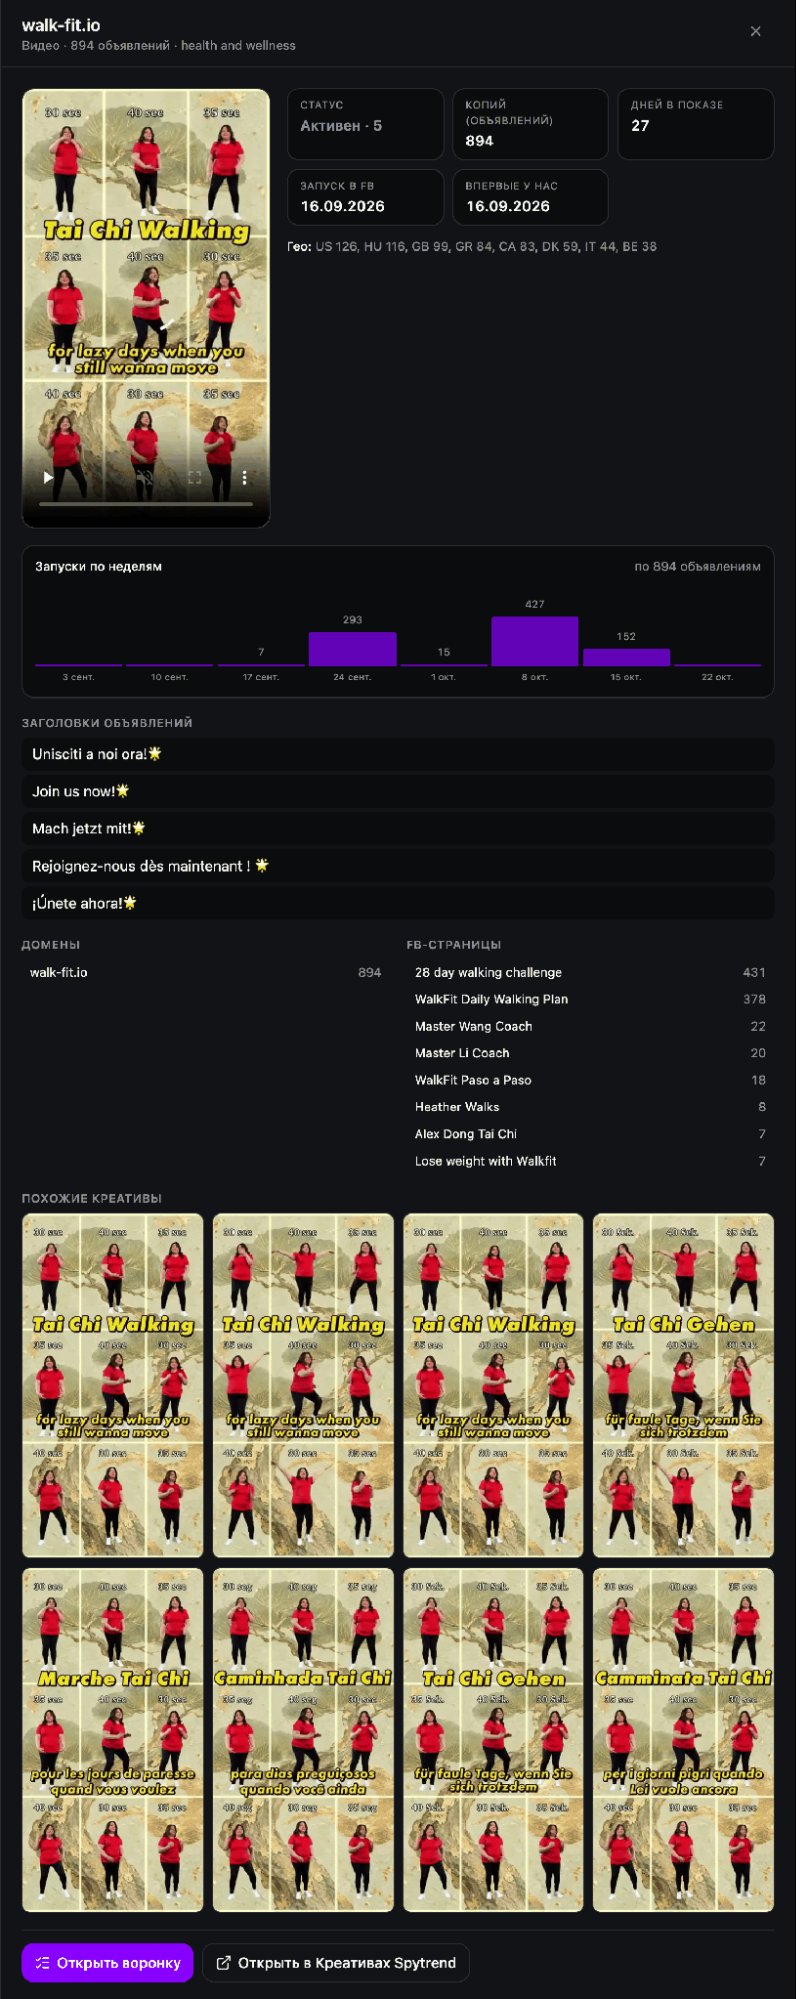
“Days running” in the panel measures the span from the creative’s first copy to its last, rather than the lifetime of one ad. At the bottom is an “Open funnel” button, the key feature of this section.
The web2app funnel library: quiz screens and paywalls
A bot works through each quiz to the end, following the flow as a regular user would. It saves a screenshot of every screen, each question and the selected answer, the plans on the paywall, and a niche classification. We keep the funnels permanently. If the bot has completed the same funnel several times, its detail panel shows every run with dates so you can compare them. We have been building the library since September 1, 2026.
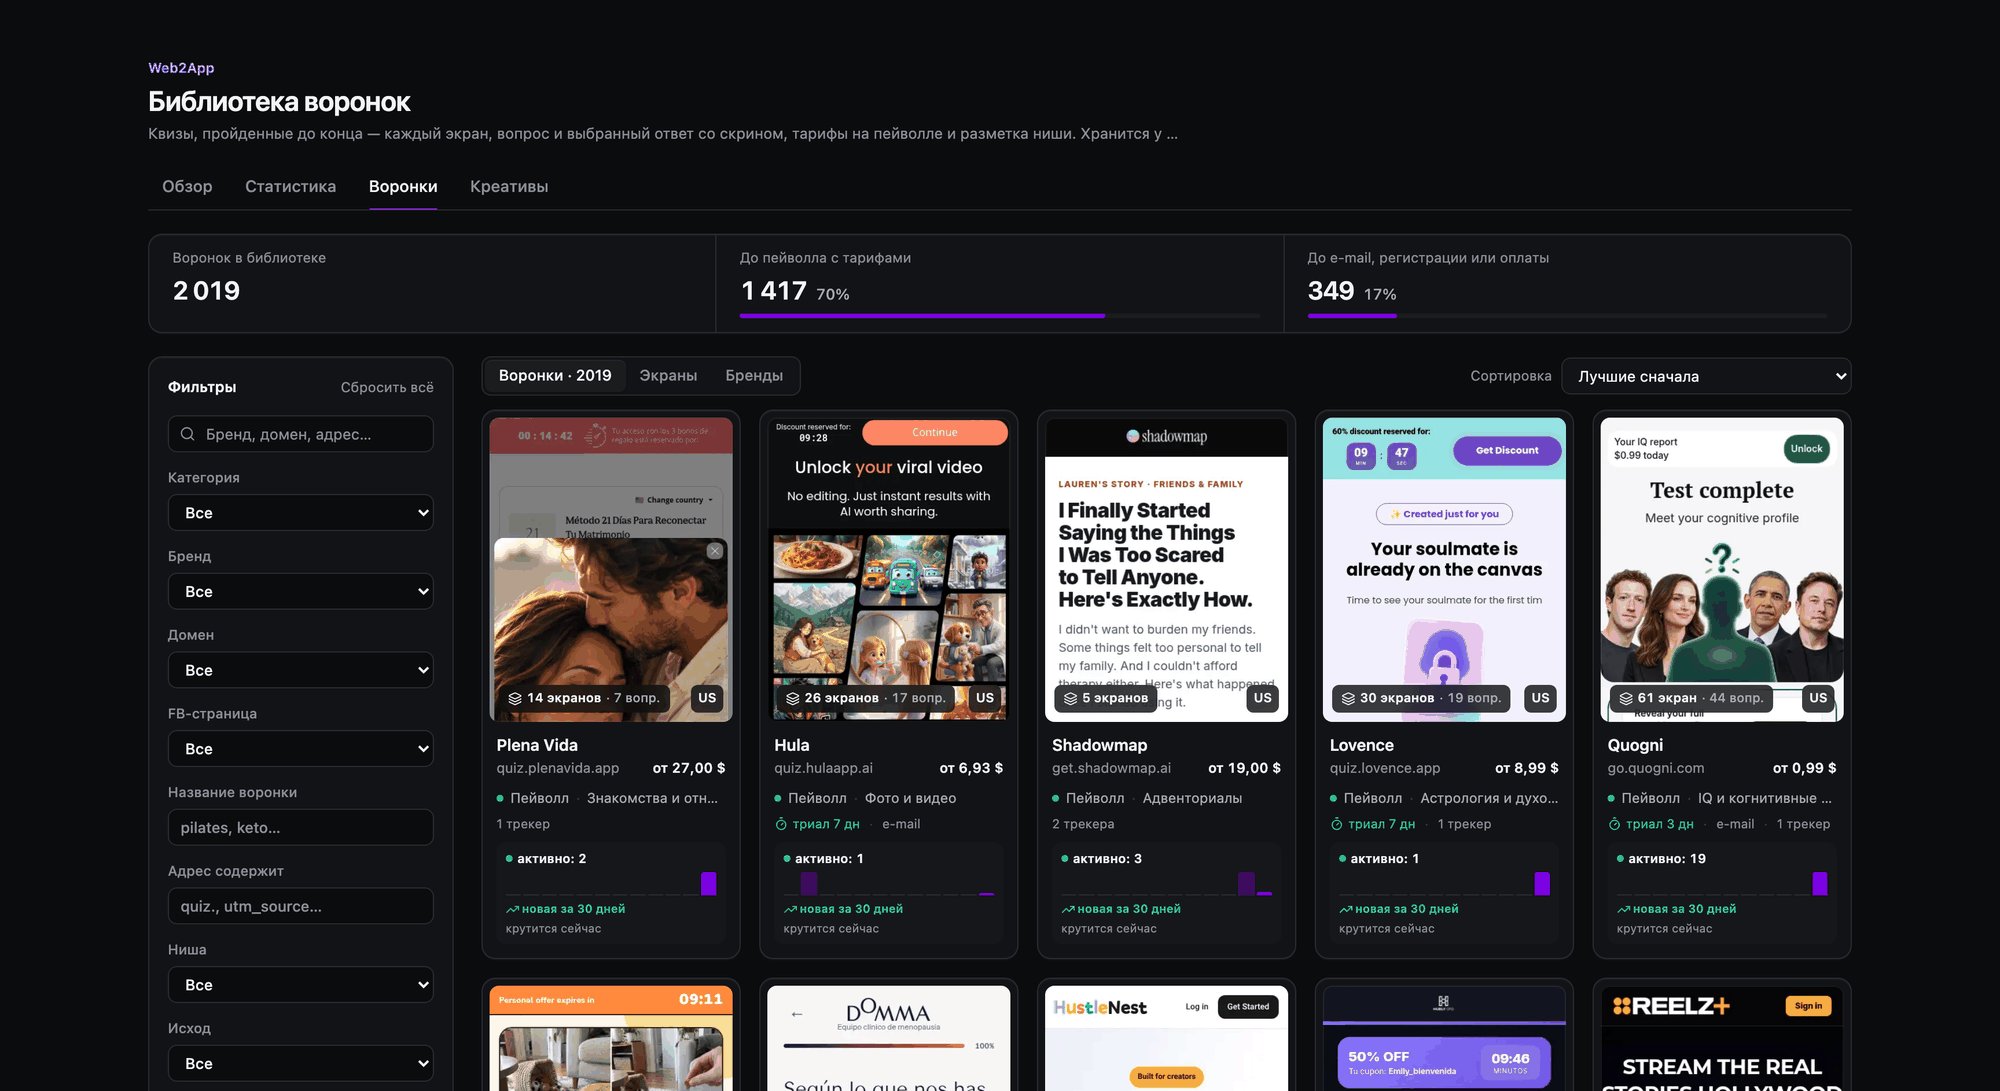
As of October 22, the library contained 2,019 funnels. For 1,417 (70%), the bot reached the paywall and identified the plans; for another 349 (17%), it reached an email, registration or payment screen. Each funnel card immediately shows whether ads are currently running to it.
Some of the most useful options are in the filters on the left; the screenshot shows only the top of the panel. They deserve a full list, because much of this would be difficult to collect manually.
- Builder. What the funnel was built with: paywallpro (243 funnels), funnelfox (166), revenuecat (20), plus a handful using clickfunnels, framer and heyflow. The builder could not be identified for most funnels.
- Trackers and platforms. Meta Pixel appears in 1,655 funnels, TikTok Pixel in 805, Snap in 364 and AppLovin in 275. Payment providers include Stripe in 143, PayPal in 83, Primer in 64 and Solidgate in 39.
- Outcome. Where the bot stopped: a paywall, payment, a phone number requirement or registration.
- Screen type. Find funnels with an upsell or a downsell after an offer is declined (downsells were found in 19 funnels).
- Language. Most are in English (1,740), but the library also includes Spanish, Portuguese, French and 19 funnels in Russian.
- Screen text. Search everything written inside the quizzes, including “money back”, “trial”, “age” and other terms.
WalkFit funnel breakdown: from quiz to paywall
Let’s open a WalkFit funnel from its Tai Chi flow, captured on September 2: the mltaichi path on walk-fit.io, for men (the URL contains gender=male). It has 51 screens, including 28 questions. Prices are in euros; the currency and amounts may differ in another country.
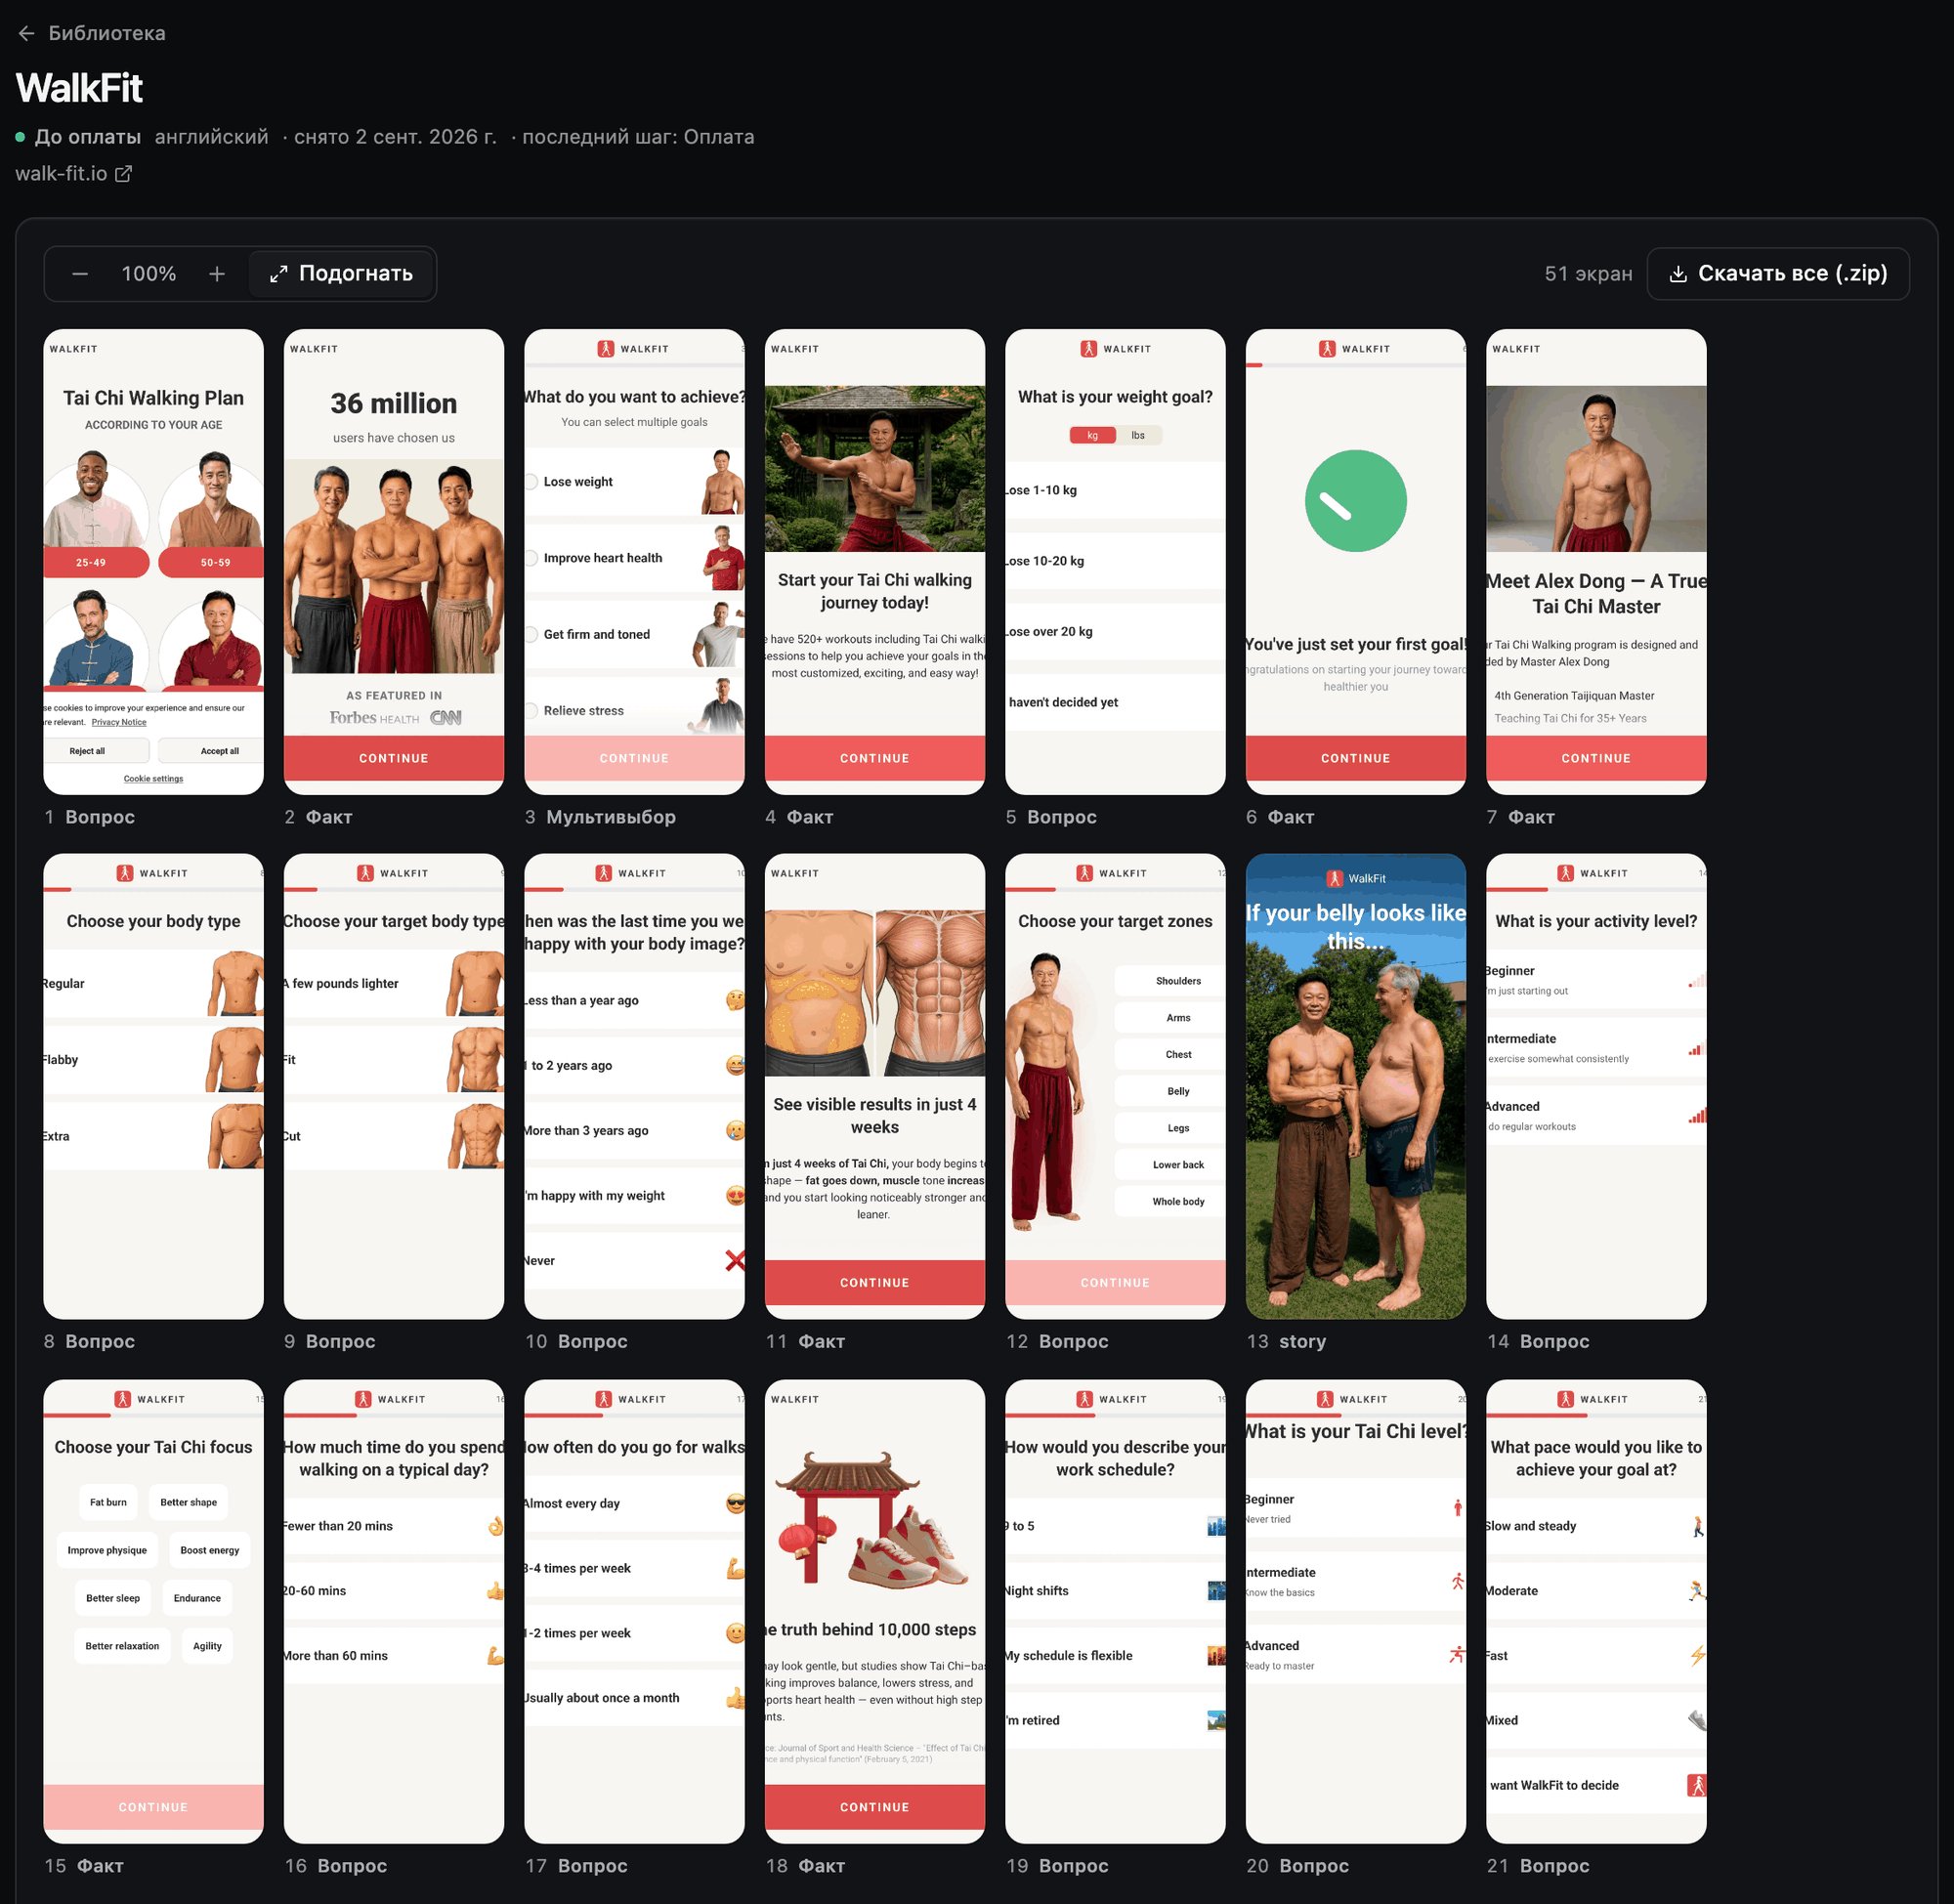
The first screen asks about age, with four buttons showing faces: 25–49, 50–59, 60–69 and 70+. This clearly is not aimed at people in their twenties. Next comes “36 million users have chosen us”, with Forbes Health and CNN badges, followed by goals, weight, current and desired body shape, and problem areas. A coach appears on screen seven: “Meet Alex Dong, a True Tai Chi Master”, described as a fourth-generation master. Alex Dong Tai Chi is also one of the Facebook pages running the Tai Chi video. The persona from the ad meets the user inside the quiz, connecting the ad and funnel.
The quiz then covers activity, how much you walk, sleep, water, bad habits and events after which you gained weight. Every two or three questions, an informational screen keeps the user engaged and builds interest. Near the end comes a loading screen saying it is calculating body mass index, fields for height, weight and age, a summary with BMI and a list of risks (high blood pressure, diabetes and stroke), and a forecast of when the user will reach their target weight.
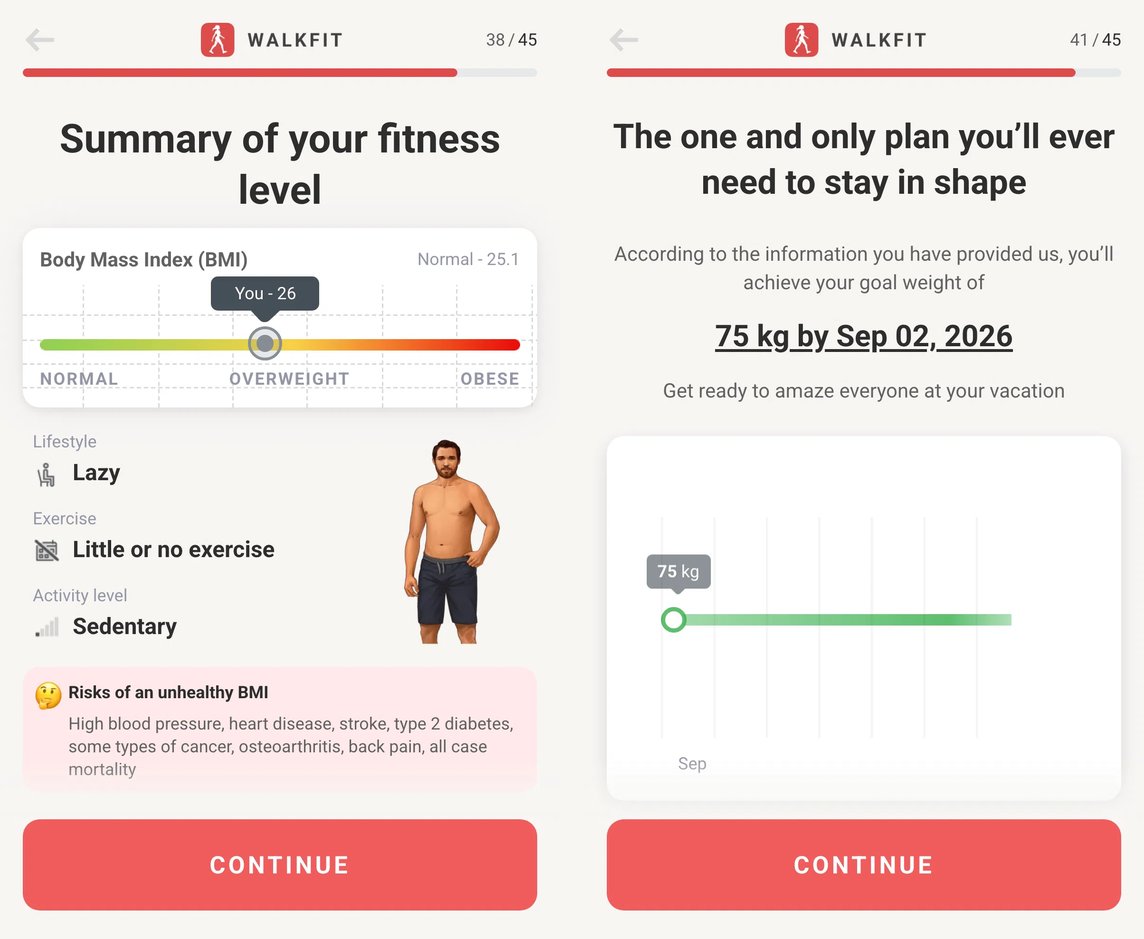
The email request comes on screen 47, after the user has answered almost thirty questions and has already invested enough effort to be reluctant to quit. The paywall is on screen 49, and payment is on screen 51.
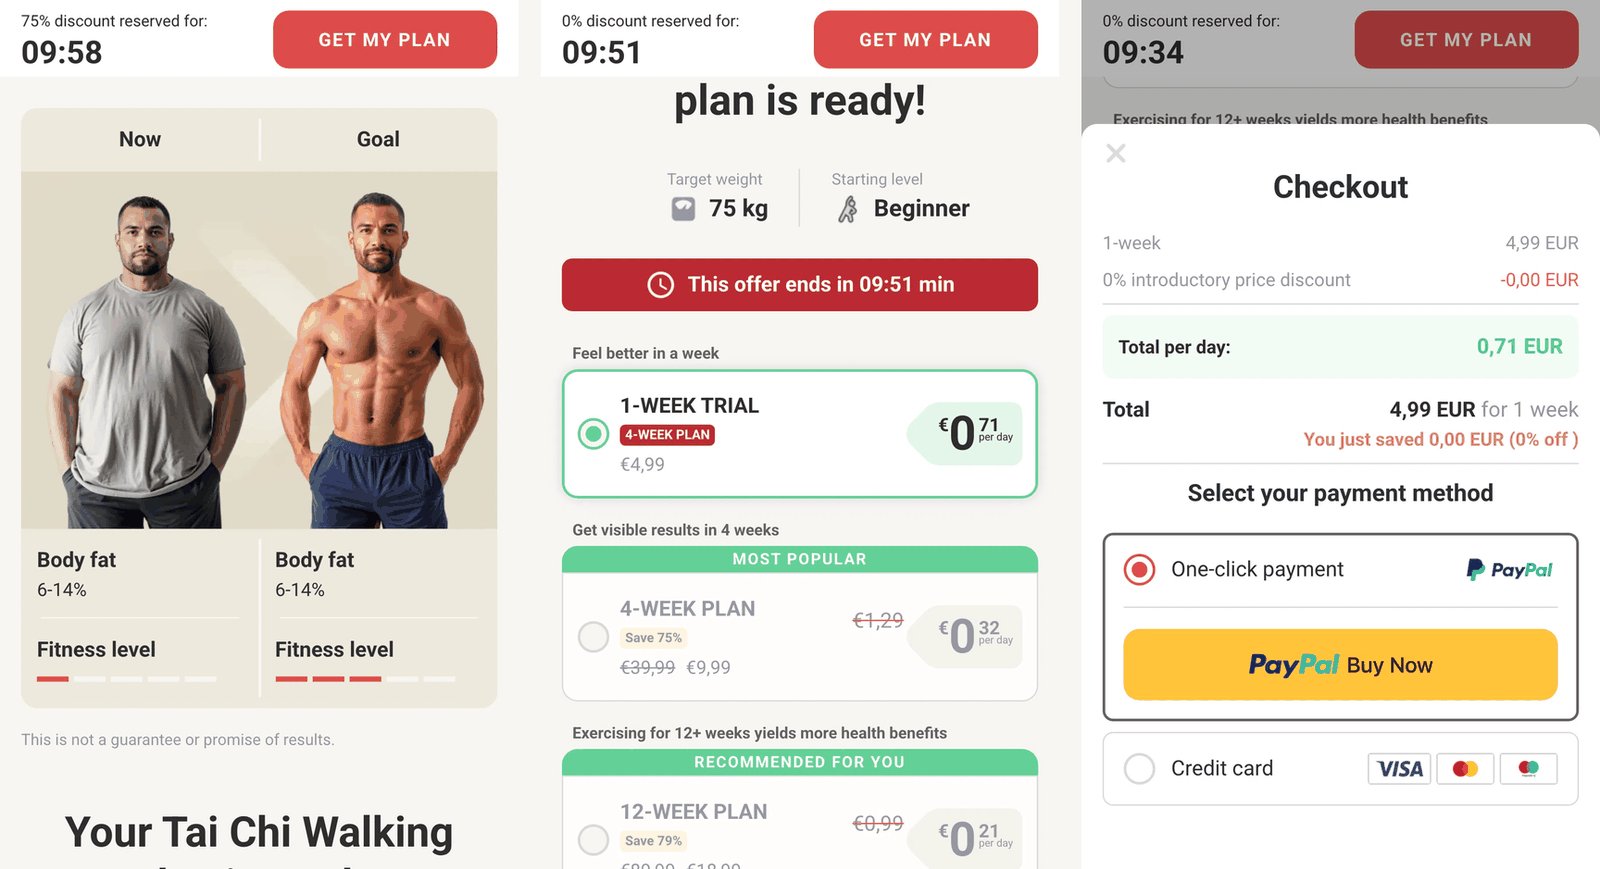
At the top of the paywall is a timer reading “75% discount reserved for: 09:58”, followed by a current-versus-target body comparison and then three plans. Each is presented with a daily price:
- a one-week trial for €4.99 (€0.71 per day);
- 4 weeks for €9.99, with €39.99 crossed out, “Save 75%” and MOST POPULAR badges, and a daily price of €0.32 instead of €1.29;
- 12 weeks for €18.99 instead of €89.99, with “Save 79%” and RECOMMENDED FOR YOU badges, at €0.21 per day.
The daily-price calculation works in the brand’s favor: 4 weeks are divided by 31 days, and 12 weeks by 90. Using the actual number of days gives €0.36 and €0.23 per day.
The catch is that only the longer plans have a discount. The bot selected the trial, and the header immediately changed to “0% discount reserved”. Checkout showed 4.99 EUR and “You just saved 0.00 EUR”. The timer and 75% discount are steering the user toward paying for a month rather than taking the trial.
The fine print below the button says the discount applies only to the first period. After that, the subscription renews at the full price of €39.99 per month until cancelled, with cancellation available in the user account or app. Above the current-versus-target comparison is “This is not a guarantee or promise of results”; below the weight chart is “for illustration purposes only”. These disclaimers adapt the funnel to Meta’s and the US Federal Trade Commission’s (FTC) requirements. Checkout supports one-click PayPal or card payment.
There are two sections on the right of the funnel detail panel. “Technologies” lists advertising pixels and trackers, payment providers, analytics and tags, and the app store listing. “Funnel” provides a profile: niche, builder, countries, number of questions, whether there is an email screen, number of versions, and a short description of the funnel’s promise and sales approach. In WalkFit’s Tai Chi flow, the bot detected Google Tag Manager and Sentry. In neighboring indoor flows on the same domain, captured on the same day, it detected Google Ads, PayPal and Solidgate.
All 51 screens can be downloaded in one archive.
How to research a subscription app funnel in Spytrend
Five steps you can use in any niche.
- In Overview, set the period to the last two or three months and check the change column. A growing brand is a first candidate for research. Ad growth signals activity, not revenue, and may reflect a domain move or newly classified data. Compare categories using absolute counts rather than percentages.
- Click the brand in Statistics to see which pages, domains and countries it uses. If an old domain is declining while a new one is growing alongside it, that is a move rather than an exit from the market.
- In Creatives, filter by brand and sort by “Most copies”. Look beyond the copy count to weekly launches: if new copies keep launching for several weeks, the brand keeps returning to that creative. You cannot tell from this whether it is profitable.
- Click “Open funnel” and review the flow: its length, question order, where it asks for an email, which plans it offers and what is selected by default.
- Search the library for similar funnels by niche, builder or screen text, then compare their paywalls.
A common question: can you promote these brands as an affiliate? We found public programs for two. BetterMe pays up to 15% per new user through Impact; WalkFit pays from $15 per new user. Both have a 30-day cookie window. But both programs are designed for bloggers and content, rather than paid Facebook traffic, and none of the leaders publicly lists payout amounts for a trial or first payment. They buy their own Meta ads through in-house teams. This section is therefore more useful for studying someone else’s funnel and building your own than for finding a ready-made offer.
Web2App access and subscription pricing
Web2App requires a separate subscription and is not included in the standard Spytrend plan. There are two options:
- monthly for $599;
- annual for $5,388, equivalent to about $449 per month, saving $1,800 (−25%). Connecting AI assistants through MCP is available only on the annual plan.
Without a subscription, the Overview tab shows the monthly chart and the top of the market-player table. The remaining rows are blurred, and filters, search and the archive are locked. A subscription unlocks everything described above: the market overview with brands and creatives; screenshots of every quiz and paywall step; prices, trials and plans; brand, niche, domain and tracker details; and search and filters across the entire library. The library is continually updated.
Open Web2App: https://spytrend.com/web2app-funnels/